10 Real Estate Software Development Companies in 2026
- February 03
- 9 min



Vacancy prediction in commercial real estate is the practice of reading turnover, payment, and lease renewal data a property management system already stores as one combined early signal of tenant departure, months before formal notice arrives.
A vacant unit in a shopping center rarely arrives without warning. Turnover reports decline for two quarters. Payment amounts shrink and arrive later than required. A renewal deadline passes without a word from the tenant. Each signal already sits inside the property management system a portfolio runs, recorded for a different purpose and read by a different team. Together, they produce a warning six months ahead of a formal notice that otherwise arrives with six weeks left. This article maps what a vacancy costs, the order these signals appear, and what six months of lead time buys a leasing team.
Key Takeaways
Lost rent is the visible cost. It is rarely the largest one.
A shopping center allocates common area maintenance, or CAM, across every leased unit based on floor area or revenue share. Once a unit sits empty, its share of cleaning, security, and landscaping cost does not disappear. It transfers to the landlord, and in some lease structures, to the remaining tenants. A portfolio with a handful of long-term vacancies absorbs that reallocation every month the units stay dark.
Occupancy rate is also a portfolio-level metric that lenders, investors, and asset management committees track on a fixed schedule. A vacancy that appears suddenly moves that number in a single reporting cycle, which draws attention at the exact moment a leasing team has the least room to negotiate calmly.
|
Cost element |
Effect while the lease runs |
Effect once the unit stands empty |
|
Base rent |
Recurring revenue |
Stops immediately, no offset |
|
Percentage rent |
Revenue tied to tenant turnover |
Drops to zero |
|
CAM allocation |
Shared across all leased units |
Landlord, or remaining tenants, absorb the empty share |
|
Utilities and security for common areas |
Spread across full occupancy |
Concentrated across fewer paying tenants |
|
Marketing and re-leasing cost |
None |
New cost, often under time pressure |
|
Reported occupancy rate |
Stable figure |
Moves visibly, reviewed by lenders and investors |
The last item on that table explains why timing matters as much as the total cost. A leasing team with six months of runway can plan a campaign, adjust terms, or line up a replacement tenant before the unit ever appears empty on a report. A team that learns about the departure six weeks out negotiates from a weaker position and often accepts worse terms just to close the gap quickly.
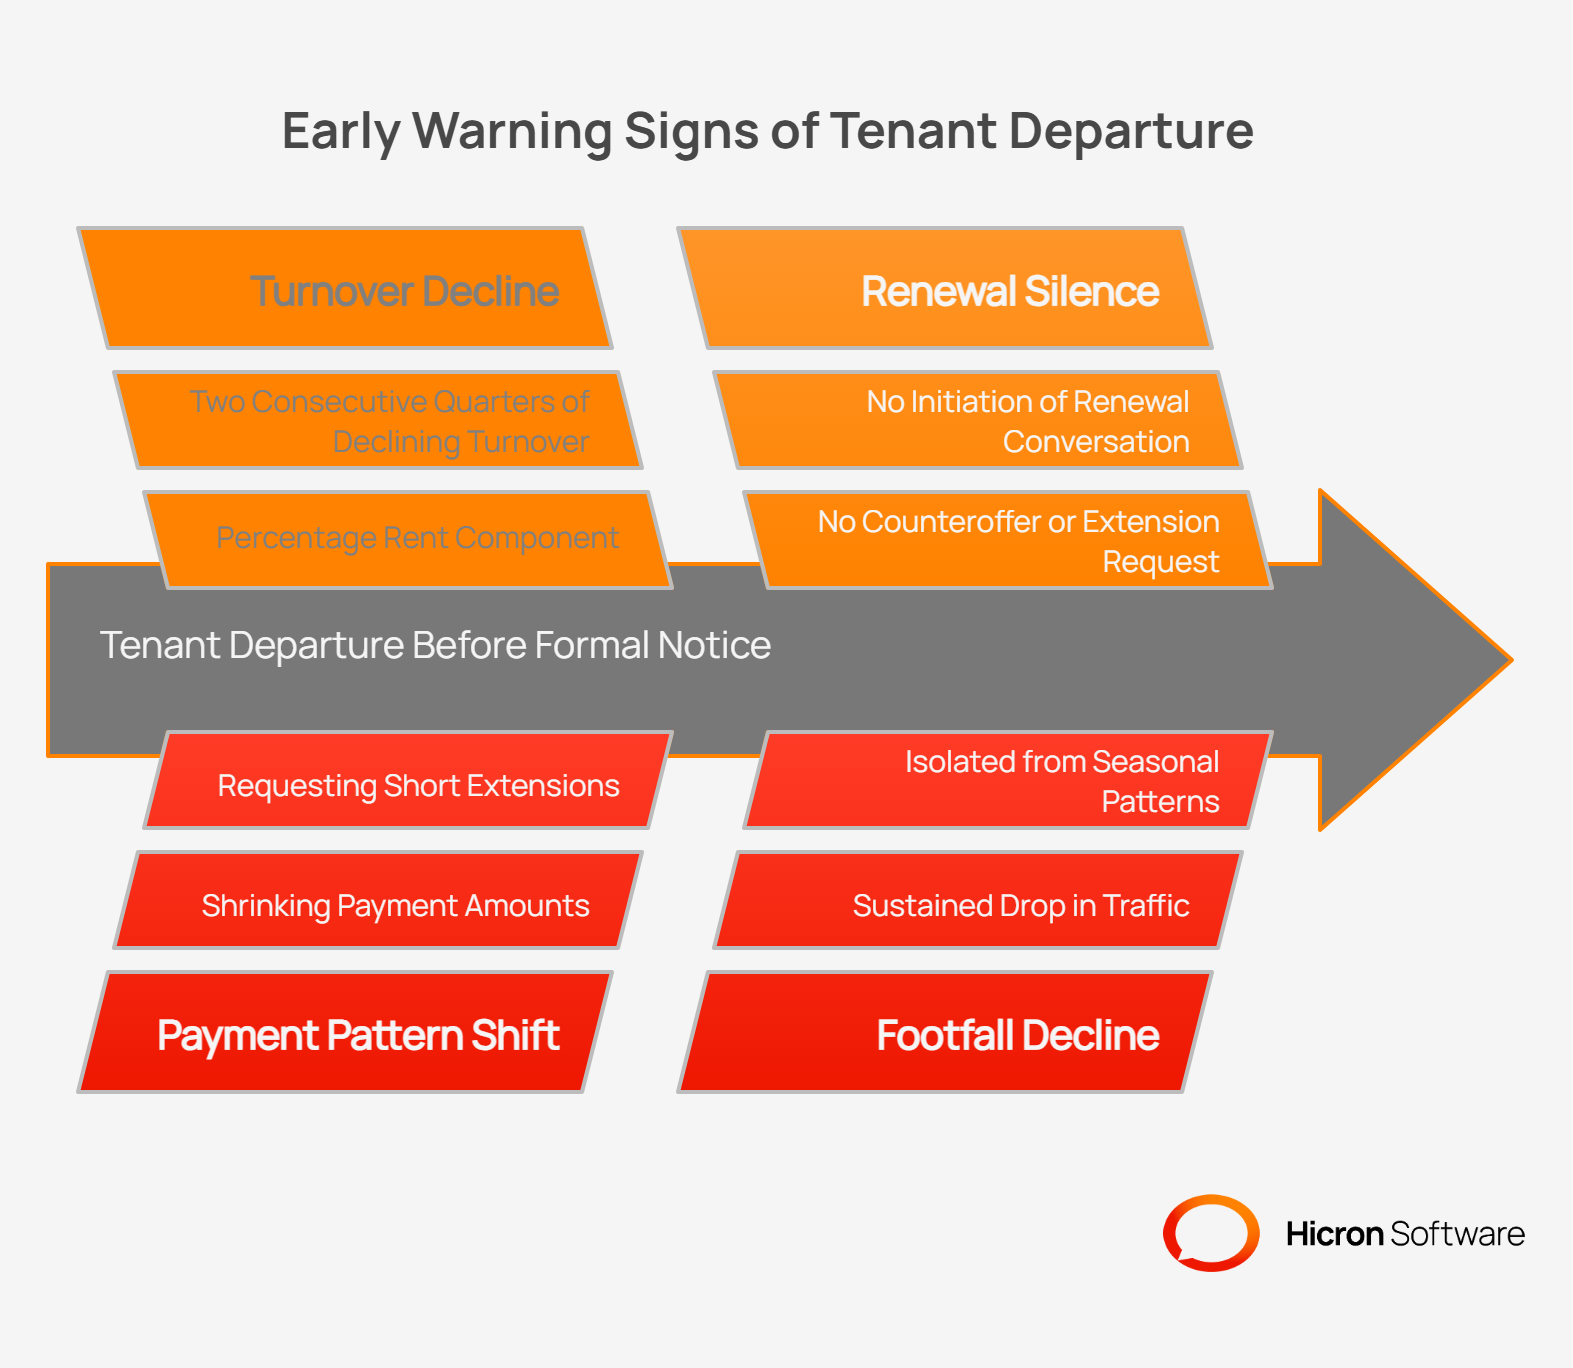
A commercial tenant rarely decides to leave overnight. The decision builds over months, and each stage leaves a trace in data the property management system already collects.
None of these signals is decisive on its own. A single quarter of soft turnover can reflect a slow season rather than an exit. The signal becomes reliable once two or three of these categories move together over a sustained period, which is exactly the pattern a combined view is built to catch.
A mid-size apparel retailer in a regional shopping center offers a useful illustration. None of the figures below are drawn from a real case. They represent the kind of pattern property managers describe when they walk back through what a system already recorded after a tenant leaves.
|
Months before departure |
What the data shows |
Where it appears |
|
Six |
Reported turnover starts trending down against the same period last year |
Turnover-based rent reports |
|
Four |
Rent payments arrive on time but for a slightly reduced amount, or a few days later than usual |
Payment ledger |
|
Three |
Footfall in the unit’s zone softens beyond the seasonal pattern for the rest of the center |
People-counting sensors |
|
Two |
The lease enters its renewal notice window with no contact from the tenant |
Lease management module |
|
Zero |
Formal notice arrives |
Lease correspondence |
Viewed at any single point on that timeline, each entry looks like routine noise. A retailer’s turnover dips for a quarter regularly, for reasons that have nothing to do with an exit. A late payment happens once and gets resolved.
The pattern reads differently once someone lines the entries up against each other for the same unit. By month three, three separate systems, turnover reporting, payment processing, and sensor data, are pointing in the same direction. That alignment is the signal a decision layer built on top of the property management system is designed to surface. Most teams currently treat the formal notice as the first indication of a problem.
An early signal is valuable mainly for the choices it keeps open while the unit is still occupied.
Every option on that list depends on lead time. None of them is available once a formal notice arrives with six weeks left on the lease.
Turnover reports, payment records, and lease renewal dates already live inside the property management system. Footfall data usually lives in a separate sensor platform tied to the building’s security or facilities infrastructure. The technical work is joining those existing sources for the same unit over the same time window.
Three steps structure that work in most portfolios.
This is an aggregation problem across data the portfolio already owns. A shopping center that already runs percentage rent, tracks lease dates, and operates people-counting sensors has every input this approach requires. The remaining work is connecting three systems that currently answer separate questions into one that answers the question a leasing team actually needs answered: which units are at risk, and how much time is left to act.
Software that handles lease administration and CAM reconciliation well is widely available today. Choosing which platform to run that layer on is a separate decision from reading the signals the current system already produces.
Four signals most often appear before a tenant gives formal notice: declining reported turnover, a shift toward smaller or later rent payments, silence through the lease renewal notice window, and softening foot traffic in the unit’s zone. Turnover decline is typically the earliest to show up.
Beyond the direct rent loss, the landlord typically absorbs a share of common area maintenance costs that would otherwise fall on the departed tenant, along with new marketing and re-leasing expenses. The vacancy also moves the portfolio’s reported occupancy rate, a figure that lenders and investors track closely.
Not at the starting point. A rule that flags declining turnover combined with renewal silence surfaces at-risk units without any predictive model. Statistical scoring becomes useful once a portfolio has validated a simple rule against past departures and wants to rank risk across a large number of units.
The core inputs are turnover-based rent reports, payment history, and lease renewal dates, all of which most property management systems already store. Foot traffic data from people-counting sensors adds a useful additional signal where the building already has that infrastructure in place.
Property managers who read turnover, payment, and renewal data together often gain a lead time of roughly six months, compared to the six weeks or less that a formal notice period typically provides. The exact window varies by lease terms and portfolio, but the underlying signals tend to build well before a formal exit conversation.
Hicron Software proved to be a trusted partner with unmatched technical expertise, delivering a scalable and user-friendly web application that was pivotal to our successful U.S. market expansion.

Hicron’s contributions have been vital in making our product ready for commercialization. Their commitment to excellence, innovative solutions, and flexible approach were key factors in our successful collaboration.
I wholeheartedly recommend Hicron to any organization seeking a strategic long-term partnership, reliable and skilled partner for their technological needs.

After carefully evaluating suppliers, we decided to try a new approach and start working with a near-shore software house. Cooperation with Hicron Software House was something different, and it turned out to be a great success that brought added value to our company.
With HICRON’s creative ideas and fresh perspective, we reached a new level of our core platform and achieved our business goals.
Many thanks for what you did so far; we are looking forward to more in future!

Hicron is a partner who has provided excellent software development services. Their talented software engineers have a strong focus on collaboration and quality. They have helped us in achieving our goals across our cloud platforms at a good pace, without compromising on the quality of our services. Our partnership is professional and solution-focused!

The IT system supporting the work of retail outlets is the foundation of our business. The ability to optimize and adapt it to the needs of all entities in the PSA Group is of strategic importance and we consider it a step into the future. This project is a huge challenge: not only for us in terms of organization, but also for our partners – including Hicron – in terms of adapting the system to the needs and business models of PSA. Cooperation with Hicron consultants, taking into account their competences in the field of programming and processes specific to the automotive sector, gave us many reasons to be satisfied.