10 Real Estate Software Development Companies in 2026
- February 03
- 9 min


A unified dashboard for multi-property portfolio management is a centralized platform that consolidates data from multiple properties and software systems into a single, interactive view. This tool acts as a single source of truth, giving real time portfolio insights to simplify management and improve decision making. By integrating information from accounting, leasing, and maintenance sources, these dashboards provide a complete picture of portfolio performance.
Managing a portfolio of properties often involves juggling information from disconnected systems. This creates data silos that make it hard to see a clear picture of overall performance. Unified property management dashboards solve this by bringing all your key data into one place. This article explains how these dashboards create a single source of truth, simplify multi property management, and support smarter, data driven decisions.
Key takeaways:
A unified dashboard is a central visual interface that pulls together key performance indicators (KPIs) from all properties in a portfolio. It serves as a single source of truth for the organization. Unlike standard reports from a single software system, a unified dashboard’s main strength is its ability to integrate data from many different sources.
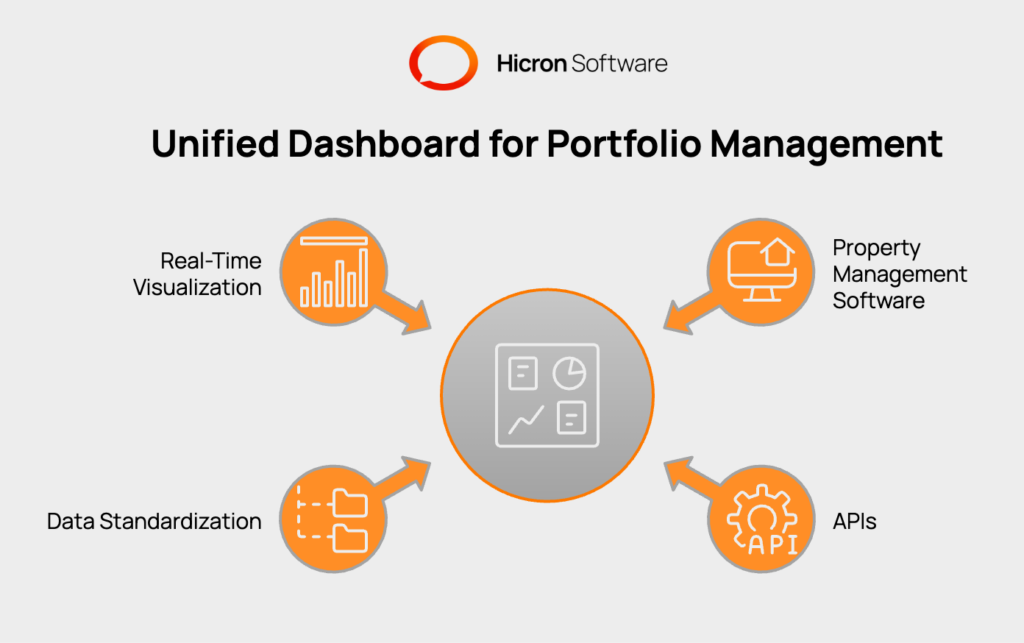
This data consolidation works through a few steps. First, the dashboard connects to systems like QuickBooks, Yardi, or other property management software through Application Programming Interfaces (APIs). It automatically pulls the necessary data. Next, the platform standardizes the information, cleaning it up so that financial and operational metrics from different properties can be compared directly. Finally, this consolidated data is displayed in easy to read charts, graphs, and tables, offering real time visualization of the portfolio.
Property managers who oversee multiple assets often use several different software systems. One property might use Yardi for accounting while another uses AppFolio. Add separate systems for maintenance requests and leasing, and the data becomes fragmented. This separation of information creates data silos.
These silos prevent managers from getting a clear, consolidated view of their entire portfolio’s performance. Comparing properties becomes a manual, time consuming task of exporting reports and combining spreadsheets. This approach is not only slow but also prone to errors, making it difficult to spot trends, identify underperforming assets, or make quick, informed decisions.
A unified dashboard gives property managers a single, reliable place to monitor their portfolio. Data consolidation brings together information from different systems and presents it in a clear and useful format. This process involves a few technical steps, each designed to keep the data accurate, consistent, and easy to interpret.
Everything starts with collecting all key information in one system and preparing it for review. This step creates the foundation needed for a unified view of property performance.
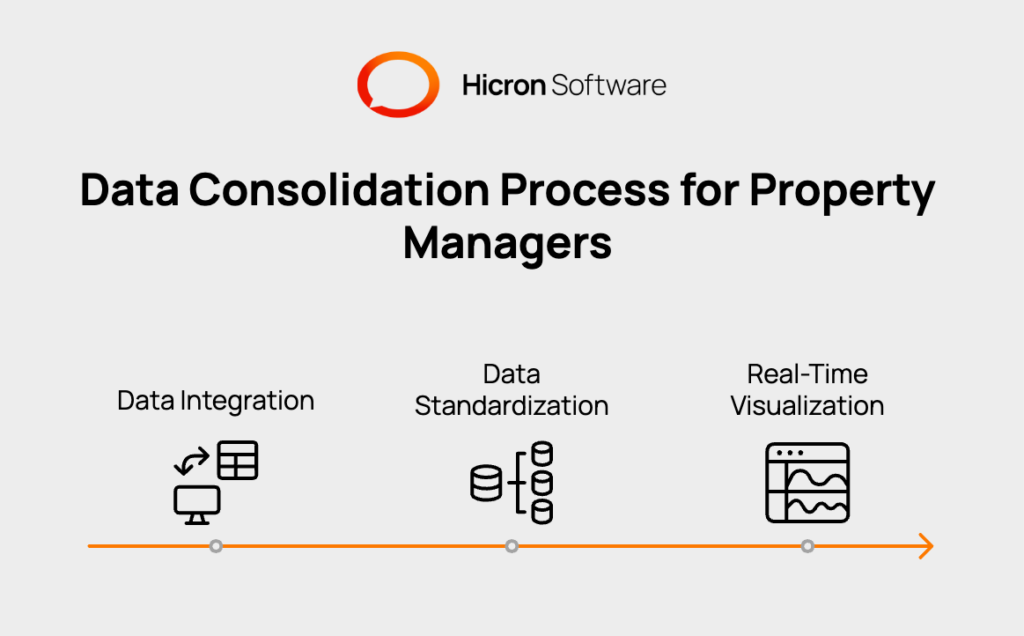
Data Integration
The first step is connecting the dashboard to each software product using Application Programming Interfaces (APIs). APIs help the dashboard bring in data directly from tools such as accounting, leasing, and maintenance software. This automated transfer removes the need to manually export and import files.
Data Standardization
The imported data often appears in several formats. To fix this, the dashboard platform organizes and refines the information to follow one clear structure. Standardized data makes it easy to compare properties, regardless of which systems each property uses.
Once the data is brought together and formatted, the next step is to present it in a visual manner that helps users make quick decisions.
Real-Time Visualization
Clean, organized data is displayed as charts, graphs, and tables. These visuals show important performance figures as they happen, so you always have up-to-date information about occupancy, expenses, and other key indicators. With this setup, your team can find answers faster and take action with confidence.
The effectiveness of a unified dashboard rests on a stack of modern technologies working together to collect, process, and present data. These tools ensure that information from different sources is accurately aggregated and displayed in a useful way. The process starts with pulling data from various systems and ends with presenting it on an intuitive visual interface.
Key technologies involved include data integration tools that connect to different software, data warehouses that store the combined information, and business intelligence platforms that create the visual dashboards. Each layer plays a specific role in turning raw, scattered data into a clear, single source of truth for portfolio management.
|
Technology Category |
Purpose |
Examples |
|
Data Integration & ETL |
Connects to source systems and moves data into a central repository. |
API Connectors, Fivetran, Stitch |
|
Data Warehousing |
Stores large volumes of structured data for analysis and reporting. |
Snowflake, Amazon Redshift, Google BigQuery |
|
Business Intelligence (BI) |
Creates interactive visualizations, charts, and reports from the data. |
Tableau, Microsoft Power BI, Looker |
|
Cloud Computing |
Provides the scalable infrastructure to host these applications and data. |
Amazon Web Services (AWS), Microsoft Azure |
An effective unified dashboard is defined by more than just the data it contains; its value comes from how it presents that information to its users. A well designed interface ensures that property managers can quickly find what they need and act on it. The design process focuses on creating a user-friendly experience while providing secure, role-specific access to information. This ensures that every team member, from an owner to a field technician, receives relevant data without being exposed to unnecessary or confidential details.
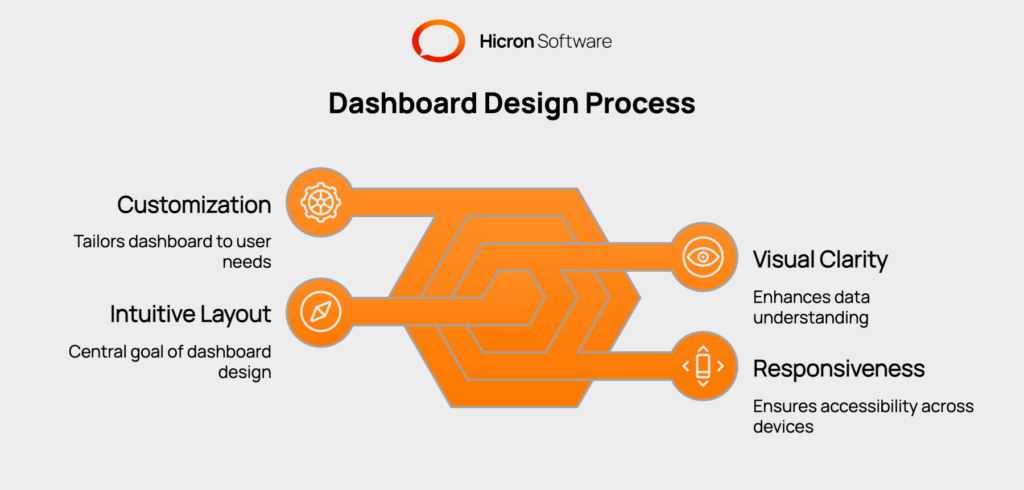
The User Interface (UI) and User Experience (UX) design process is central to making dashboards practical. The main goal is to create a clean, intuitive layout where users can locate information without confusion. Good design translates complex data sets into easily understandable visuals.
Best practices for dashboard design prioritize visual clarity. This involves using a
to guide the user’s eye to the most important metrics. For example, using red or green indicators can instantly show performance against a target. The layout should also be responsive, meaning it adjusts automatically to fit any screen size, whether on a desktop computer in the office or a tablet in the field. This ensures a consistent and functional experience across all devices.
Customization is another key element. Users should be able to rearrange widgets or choose which KPIs are most visible to them. This flexibility allows each user to tailor the dashboard to their specific workflow, improving engagement and making the tool a more integral part of their daily routine.
Not everyone in a property management organization needs to see the same information. Role-based dashboard design addresses this by creating tailored views that match the responsibilities of different users. This approach enhances usability by presenting only relevant data and strengthens security by restricting access to sensitive information.
Permission controls are integrated into the system to manage what each user can see and do. This delivers specific KPIs and functions to each stakeholder based on their role:
By controlling information access and tailoring views, role-based design makes the dashboard a more powerful and secure tool for the entire organization.
Adopting a unified dashboard involves a structured implementation process to ensure it meets the organization’s specific needs. A careful implementation ensures the dashboard delivers accurate, actionable insights from day one.
|
Step |
Description |
Key Actions |
|
Step 1: Discovery and Planning |
Define the primary goals for the dashboard and identify the necessary data sources to meet organizational needs. |
Determine which Key Performance Indicators (KPIs) are most important for tracking portfolio performance and making strategic decisions. |
|
Step 2: Technical Setup and Data Integration |
Establish the connections needed to pull data automatically from existing software systems into the new dashboard platform. |
Configure Application Programming Interface (API) connections to systems for accounting, leasing, and maintenance. |
|
Step 3: Data Mapping and Standardization |
Organize and format data from various sources to ensure consistency across the entire portfolio. |
Map data points from different systems and standardize them to allow for accurate, direct comparisons between properties. |
|
Step 4: Dashboard Design and Configuration |
Create tailored dashboard views for different team members based on their roles and responsibilities. |
Design and configure role-based dashboards for owners, regional managers, and site staff to ensure users see relevant information. |
|
Step 5: Team Training and Launch |
Prepare the team to use the new tool effectively and officially roll out the dashboard across the organization. |
Conduct training sessions for all users and formally launch the platform for company-wide use. |
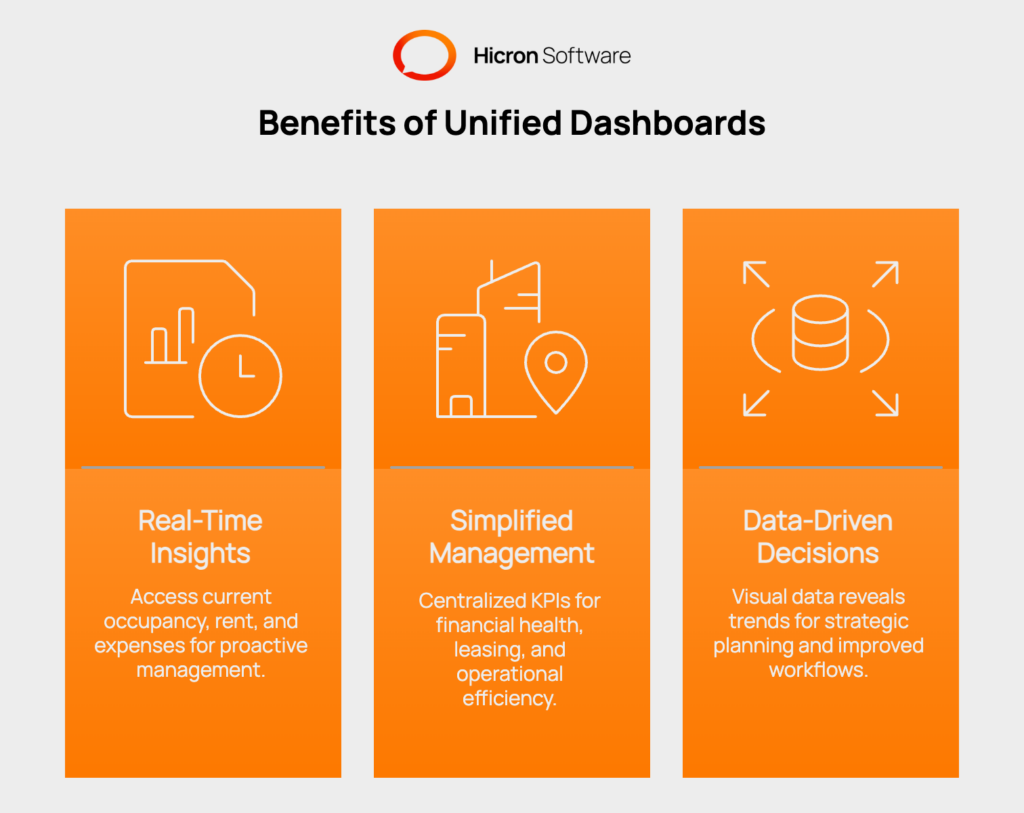
Traditional property management often relies on monthly or quarterly reports. By the time these reports are compiled, the information is already dated. Unified dashboards change this by providing real time insights. Managers can see current occupancy rates, track rent collections as they happen, and monitor expenses as they are logged.
This access to live data allows for proactive management. An unexpected rise in maintenance costs at one property can be spotted and addressed immediately. A dip in leasing activity can be identified and corrected before it affects monthly goals. Dashboards can also be customized to provide specific views for different stakeholders, giving owners financial overviews and managers operational details.
A unified dashboard simplifies the complexities of managing multiple properties by centralizing all essential KPIs. Metrics like financial health, leasing performance, and operational efficiency are all tracked in one place. This makes it possible to see at a glance how the entire portfolio is performing.
This centralized view also enables effective benchmarking. Managers can easily compare the performance of different assets to identify which properties are leading and which are lagging. This helps uncover best practices at top performing properties that can be applied across the rest of the portfolio. It also highlights areas that require more attention or resources, making management more strategic.
Unified dashboards transform information overload into actionable intelligence. By presenting complex data in clear, visual formats, they reveal trends and opportunities that might be missed in spreadsheets. This data driven approach supports better strategic planning, helping leaders decide where to allocate capital, which marketing efforts are working, and how to improve operational workflows.
These dashboards also improve reporting to investors and stakeholders. Instead of spending hours creating manual reports, managers can generate comprehensive, professional-looking portfolio summaries with a few clicks. This efficiency builds trust and transparency with property owners and investors, demonstrating a clear command of the portfolio’s performance.
Unified dashboards deliver complete visibility by consolidating data, simplifying management with real-time portfolio insights, and enabling data-driven strategic planning. Built on advanced technology and user-centered design, these platforms offer a clear view of performance across all assets. Adopting a unified dashboard is a fundamental tool for any property management company aiming for scalable growth and operational excellence. By bringing all information into one place, these systems empower teams to work smarter and more proactively.
Ready to gain a holistic view of your entire portfolio? Contact us to streamline your operations.
A unified dashboard is a tool that connects to all your different software systems (like accounting and leasing) to pull data into one central place. It gives you a complete, real time view of your entire property portfolio, helping you track performance without switching between multiple applications.
They simplify multi property management by allowing you to see and compare key metrics like occupancy, rent collection, and expenses for all properties side by side. This makes it easy to identify best practices at one property and apply them elsewhere, or to spot issues at a specific location quickly.
You can typically see a wide range of data, including financial KPIs (like net operating income and budget vs. actuals), leasing performance (occupancy and renewal rates), and operational metrics (like the number of open work orders and maintenance turnaround times).
The setup process involves connecting to your existing software through APIs and configuring the dashboard to display the metrics that are most important to your business. The goal is to make the implementation process straightforward for the property manager.
Yes, most unified dashboards offer role based access. This means you can create custom views for different people. For example, an owner might have a high level financial overview, while a property manager sees more detailed operational data for their specific properties.
Tracking portfolio-wide performance across multiple properties requires a combination of technology, data integration, and clear metrics. Here are some key steps and tools to consider:
Identify the most important KPIs for property managers, such as occupancy rates, lease renewals, and maintenance requests. Use an analytics tool that allows dashboard customization,look for features like drag-and-drop widgets and real-time data from your property management system. Set up role-based dashboard templates that managers can personalize. Provide brief training so users can adjust layouts, set alerts, and generate automated reports.
Customizable dashboards let property managers monitor performance at a glance, respond quickly to issues, and make informed decisions to improve operations.
Hicron Software proved to be a trusted partner with unmatched technical expertise, delivering a scalable and user-friendly web application that was pivotal to our successful U.S. market expansion.

Hicron’s contributions have been vital in making our product ready for commercialization. Their commitment to excellence, innovative solutions, and flexible approach were key factors in our successful collaboration.
I wholeheartedly recommend Hicron to any organization seeking a strategic long-term partnership, reliable and skilled partner for their technological needs.

After carefully evaluating suppliers, we decided to try a new approach and start working with a near-shore software house. Cooperation with Hicron Software House was something different, and it turned out to be a great success that brought added value to our company.
With HICRON’s creative ideas and fresh perspective, we reached a new level of our core platform and achieved our business goals.
Many thanks for what you did so far; we are looking forward to more in future!
Hicron is a partner who has provided excellent software development services. Their talented software engineers have a strong focus on collaboration and quality. They have helped us in achieving our goals across our cloud platforms at a good pace, without compromising on the quality of our services. Our partnership is professional and solution-focused!

The IT system supporting the work of retail outlets is the foundation of our business. The ability to optimize and adapt it to the needs of all entities in the PSA Group is of strategic importance and we consider it a step into the future. This project is a huge challenge: not only for us in terms of organization, but also for our partners – including Hicron – in terms of adapting the system to the needs and business models of PSA. Cooperation with Hicron consultants, taking into account their competences in the field of programming and processes specific to the automotive sector, gave us many reasons to be satisfied.
