Trade Cycle Management in Automotive: How It Works, a UK Case and U.S. Figures for 2026

What is trade cycle management in automotive?
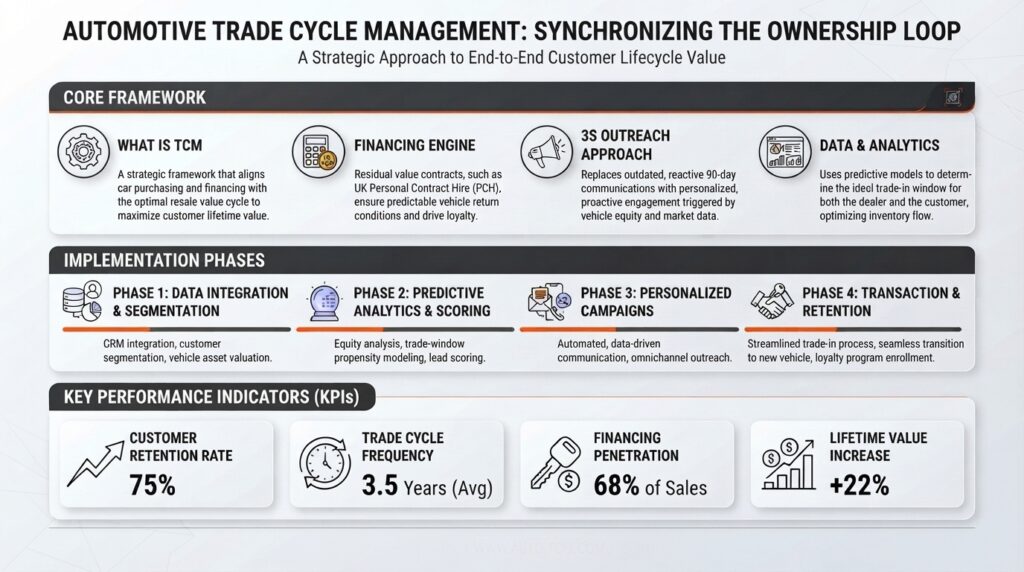
Trade cycle management (TCM) in automotive is a strategic approach that synchronizes buying, owning and getting rid of a car: the purchase, the regular maintenance and warranty work that follow, and the trade-in that starts the next cycle. Capital markets use the same term for an unrelated process, the trade lifecycle.
In the U.S., only 54% of owners of vehicles under 2 years old returned to their selling dealership for service in 2025, down from 72% in 2023, according to Cox Automotive.
On top of the car purchase itself, the two critical parts are maintenance and the trade-in, in Tomasz Bogacki’s framing, and managing them together is one way to get predictable revenue streams. The finance mechanism and the campaign case below come from the UK; U.S. figures for 2025-2026 follow.
How does residual value financing set the timing of the next car purchase in the UK and the U.S.?
Residual value financing sets the timing of the next purchase because the agreement fixes a future value for the car at the start, so the end of the term becomes a known point at which the customer may hold equity. In Bennett’s account, trade cycle management is built around this kind of financing, known in the UK as personal contract purchase (PCP).
Under a UK PCP agreement, the customer pays a deposit and monthly payments calculated against a Guaranteed Minimum Future Value (GMFV) set at the start of the contract, according to the Finance & Leasing Association’s guide to personal contract purchase. At the end of the term, the customer can pay the GMFV and own the car, hand the car back and walk away, or put any equity above the GMFV toward a deposit on a new agreement.
The difference from conventional credit is what creates the timing:
| Question | Conventional hire purchase or installment credit | Residual value financing (UK PCP) |
| When does the customer own the car? | Only after the last payment, for example after 48 or 60 months | Only if the customer pays the GMFV at the end of the term |
| Who carries a fall in the car’s market value? | The buyer | The finance company, which predicts the car’s future value from its knowledge and historical data |
For the customer, in Bennett’s description, the deal amounts to a guaranteed trade-in price for the car, based on the contracted mileage and given when the car is driven away; in the example he showed, the plan ran for 36 months.
Because a good chunk of the vehicle’s value is deferred to the end of the contract, monthly payments go further and customers can choose a bigger or better car. If the car is then worth more than the value set at the start, the customer keeps the difference and can use it as a deposit on a new car.
Car finance, and PCP in particular, is widespread in the UK:
| Indicator | Value | Period | Geography | Source |
| Private new car purchases funded by member lenders of the Finance & Leasing Association | Almost nine in ten | First half of 2026 | UK | Finance & Leasing Association (checked September 17, 2026) |
| PCP share of motor finance agreements in the Financial Conduct Authority’s Cost of Living consumer credit data collection | Over half | Reported October 2025 | UK | Financial Conduct Authority |
| Typical term of motor finance agreements (PCP, hire purchase, conditional sale) | Two to five years | Reported October 2025 | UK | Financial Conduct Authority |
A UK PCP customer can also end the agreement early. Under the Consumer Credit Act 1974, a customer with a PCP agreement can return the car to the finance provider once they have paid half of the car’s cost, or make up the difference to half, which MoneyHelper, the UK government-backed guidance service, calls voluntary termination. That halfway point is a second predictable moment for a dealer or lender to talk to the customer.
A finance agreement can also be fashioned around the period in which the car stays within the manufacturer’s warranty, so that the customer avoids losses. In the U.S., all new cars come with a warranty that provides at least three years or 36,000 miles of coverage, according to U.S. News & World Report’s 2026 guide to car warranties (see also automotive warranty software).
In a U.S. vehicle lease, the leasing company sets what the vehicle will be worth at lease end, known as the residual value, and that value is used to calculate the monthly payment, according to the Consumer Financial Protection Bureau (CFPB). With a purchase option, the residual value is also the buyout price at lease end; a typical lease runs two to four years, according to CFPB guidance last reviewed September 12, 2023.
The end of a U.S. lease plays a similar role: a date known in advance at which a dealer or lender can prepare the next offer. Ending a lease early may bring early termination charges that can be very expensive, according to the CFPB. The main product types of residual value funding are described in a separate article on residual value funding in automotive.
When should a dealer or lender contact the customer? The 3S approach
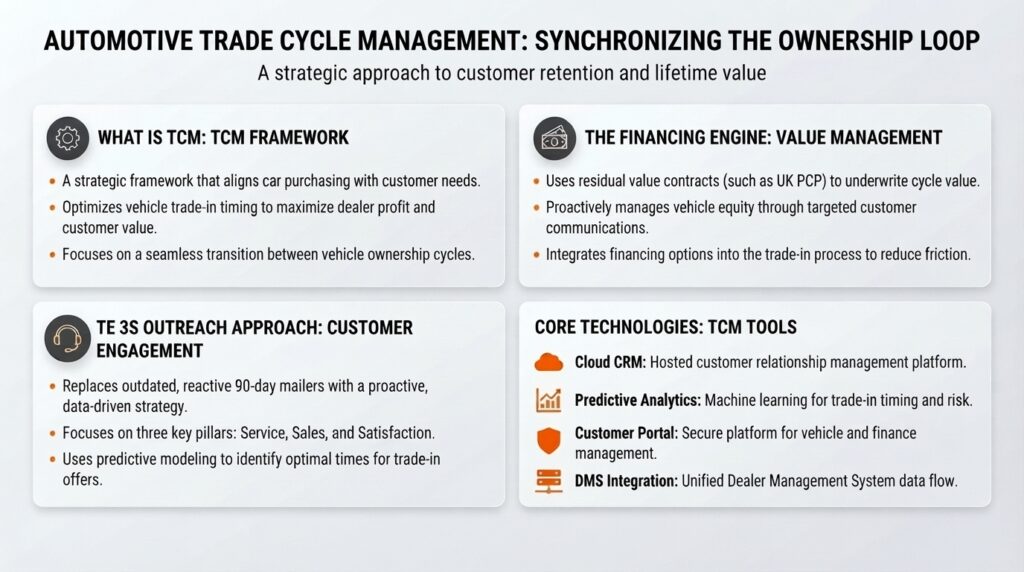
A dealer or lender should contact the customer when a specific message can reach a specific individual at a specific time. That is Bennett’s 3S approach, built around an offer hyper-personalized to each customer.
In practice that means reaching a customer with 12 payments left and offering a new or newer car for the same or a very similar monthly payment, with no additional deposit. For a manufacturer, he said, a revolving database in which part of the portfolio is always approaching that point gives a recurring revenue stream.
The opposite is the reactive approach. Before digital tools spread over the 15 years to 2025, car finance was a pen-and-paper process in which the customer got a welcome letter and heard nothing more as long as payments were made. Then a letter arrived 90 days before the contract ended, telling the customer they had three payments left and suggesting a visit to the dealer.
The timing matters, he explained, because most people nearing the end of a finance contract are happy for it to end and plan to redirect the payment to other debt built up over two, three or four years. Without technology, the numbers cannot be crunched fast enough to reach customers at the right time.
Tomasz Bogacki pointed to IT tools as what helps automakers and dealerships here: an ecosystem in which OEMs, their captive or external finance providers and dealers use the same platform, so that information is exchanged systematically.
He also named AI as a way to predict market trends, residual values and the best time to offer a trade-in to a given customer.
The moment of contact depends on three pieces of data that often sit with different parties:
- the remaining term of the finance agreement, held by the lender;
- the estimated equity position, which depends on the residual value in the agreement and the car’s market value;
- the service history, which the dealer holds when the customer services the car there.
What did a UK trade cycle campaign by a carmaker’s finance company achieve?
In one UK campaign Paul Bennett described, 882 of the 1,260 customers in the campaign (70%) were given an appointment, 388 bought a replacement car and 329 trade-ins qualified for the dealer to keep and resell.
This is a single, anonymized campaign: it shows where customers drop out when the timing is right, not what results to expect in the U.S.
The data came from a large manufacturer’s finance company whose name Bennett could not disclose for non-disclosure reasons. Over three months, retailers contacted the customers using a third-party platform.
| Stage | Customers | Conversion |
| Customers in the campaign | 1,260 | |
| Given an appointment after a telephone contact | 882 | 70% of 1,260 |
| Attended the showroom appointment | 485 | A little over half of the 882 |
| Bought a replacement car | 388 | 80% of 485 |
| Trade-ins that qualified for the dealer to keep, recondition, remarket, resell and refinance | 329 | 85% in Bennett’s figure, which matches 329 of the 388 buyers if each buyer traded in a car |
The counts and percentages are Bennett’s, except the share of the 485 against the 882, calculated here.
Many customers with appointments dropped off because they had not been followed up, Bennett said, and he called the result a “gold mine” reachable only by using data strategically, which cannot be done manually.
The case has clear limits. It covers one finance company in one market, the campaign dates were not disclosed, and the figures come from a slide shown in 2025, not from a published report. It does not support a market average for the UK or for the U.S.
Why do carmakers manage the used car cycle, not just new car sales?
Carmakers manage the used car cycle because the same car can return to their network and be sold and financed again. Residual value arrangements are one reason they can: the arrangements make sure that cars sold one, two or three years earlier come back to the used car pool of the same brand and dealership instead of being sold without the manufacturer’s involvement.
What happens next is a second sales cycle. A car traded in at the end of a residual value contract returns to the dealership to be reconditioned, remarketed and refinanced, and a documented history such as two years, 25,000 kilometers and servicing from new makes it a compelling used car offer.
One very large German manufacturer planned three life cycles for each imported vehicle, in an example Bennett gave from his own work:
- a residual value product for two or three years, sold as a new car
- a second residual value product for two or three years after reconditioning
- a four-year conventional credit plan, by which time the car was 10 years old
The same planning protects used car prices. A manufacturer has to sell as many new vehicles as possible while managing the used car market carefully, because too many returns sent to auction houses at once can depress prices. The discipline this requires is what Bennett called “starting with the end in mind”: managing the ownership and the vehicle cycle, not just selling a vehicle and gaining market share.
Can service contracts keep customers returning as EVs need less maintenance?
Prepaid maintenance plans can keep customers returning to the dealership as electric vehicles need less maintenance, Bogacki argued, while J.D. Power’s director of automotive retail tied return visits for customer-paid work to the service experience. How electrification changes aftersales revenue more broadly is covered in a separate article on the impact of electric vehicles on aftersales.
In his account, the rapid increase in electric vehicle sales poses a threat to automakers, European and Chinese alike, because an electric vehicle requires significantly less maintenance than a vehicle with an internal combustion engine. His answer to it was to get the customer to sign a prepaid maintenance plan, which makes them return to the dealership even if nothing breaks.
He makes the same point about bundled plans in general: paid for in advance, they make sure customers return for periodic maintenance and create a platform to interact with the customer.
How much less maintenance do battery-electric vehicles need?
The U.S. Department of Energy estimates the scheduled maintenance cost of a light-duty battery-electric vehicle at 6.1 cents per mile, versus 10.1 cents per mile for a conventional internal combustion engine vehicle, in a 2021 comparison of scheduled maintenance costs. That is about 40% lower for the battery-electric vehicle.
In Norway, battery-electric cars took 95.9% of new passenger car sales in 2025, according to OFV. Norwegian dealers report 30% fewer hours sold and 50% lower parts revenue for routine maintenance, including oil changes, according to a February 2026 column by ICDP managing director Steve Young published by Motor Trader.
Do prepaid maintenance plans bring customers back for paid service?
In the press release for J.D. Power’s 2025 U.S. Customer Service Index Study, published in March 2025, John Tenerovich, director of automotive retail at J.D. Power, said complimentary maintenance programs drive strong retention, while intent to return for customer-paid service depends on the service experience the dealer delivers (see also automotive aftersales services).
What do U.S. service, loyalty and finance figures for 2025-2026 show about the trade cycle?
U.S. franchised dealerships’ share of service visits fell between 2018 and 2025, and a larger share of new-vehicle loans ran longer than six years in Q1 2026 than a year earlier; both trends matter for the timing of a trade cycle offer. Brand loyalty rates from three studies range from 49% to 53.4% as of September 17, 2026, but they cover different periods and methods and are not combined here.
Service revenue and retention at U.S. franchised dealerships
U.S. franchised dealerships’ share of vehicle service visits fell from 33% in 2018 to 29% in 2025, according to Cox Automotive’s 2025 Service Industry Study. In the same study, owners who had returned to a dealership for service in the past 12 months were 74% likely to buy their next vehicle from that dealership, versus 44% of those who had not; the figures measure stated likelihood, not purchases.
Cox Automotive reported the greatest dealership decline among vehicles five years old or less: for vehicles under 2 years old, the dealer share of service visits fell from 68% in 2018 to 55% in 2025.
The National Automobile Dealers Association’s annual financial profile of franchised new-car dealerships gives the weight of service and parts in dealership sales, and an older NADA figure gives its weight in gross profit:
| Indicator | Value | Period | Geography | Source |
| Service and parts department share of total sales dollars at the average franchised new-car dealership | 13.3% (13.2% in 2024) | Full year 2025 | U.S. | NADA Data 2025 (checked September 17, 2026) |
| Service and parts department share of combined new-vehicle, used-vehicle and service/parts department gross profit at the average franchised dealership | About 47% | Calendar year 2016 (historical figure) | U.S. | NADA figures relayed by WANADA; calculated from the dollar amounts |
U.S. brand loyalty in three studies
| Study and publisher | Brand loyalty rate | Period | Geography |
| J.D. Power 2025 U.S. Automotive Brand Loyalty Study, all nameplates and segments | 49% (51% in the 2024 study) | Transactions September 2024 to August 2025, published September 24, 2025 | U.S. |
| S&P Global Mobility, industry-wide brand loyalty rate | 51.1% (down 1.4 percentage points from the same period in 2024) | January to June 2025 | U.S. |
| LexisNexis Risk Solutions mid-year 2026 Automotive Brand Loyalty Study, new vehicles | 53.4% | January to June 2026 (checked September 17, 2026) | U.S. |
The three rates come from different studies and periods, so the table does not show a trend and the values should not be averaged.
U.S. auto finance: leasing, lenders and loan terms
| Indicator | Value | Period | Geography | Source |
| Leasing share of new vehicles | 23.75% (24.04% in Q2 2025) | Q2 2026 | U.S. | Experian (checked September 17, 2026) |
| Loan share of new vehicles | 59.57% (57.45% in Q2 2025) | Q2 2026 | U.S. | Experian (checked September 17, 2026) |
| Shares of total vehicle financing: banks, captive finance companies, credit unions | 27.15%, 26.26%, 20.38% | Q2 2026 | U.S. | Experian (checked September 17, 2026) |
| Captive finance companies’ share of new-vehicle financing | 52.39% (60.74% in Q2 2024) | Q2 2025 | U.S. | Experian (checked September 17, 2026) |
| Average loan term for used vehicles | 67.86 months | Q2 2026 | U.S. | Experian (checked September 17, 2026) |
In Q1 2026, 35.55% of new-vehicle loans in the U.S. ran longer than six years, up from 30.83% a year earlier, and in Q2 2026 the average new-vehicle loan term was 69.46 months, according to Experian.
What does trade cycle management look like in the U.S.? Equity mining and lease pull-ahead programs
In our reading, the closest U.S. counterparts to trade cycle management are equity mining at dealerships and lease pull-ahead or loyalty programs at captive lenders. The mechanism stays the same, a known point in the finance agreement at which the customer can move into a new vehicle, while the product and the name change (see also automotive digital retailing).
The approach is not new to the U.S. market. About 25 years ago, Paul Bennett worked on a team, with a U.S. company, that transformed how Ford Credit operated finance products built around trade cycle management in Europe, several other markets and the U.S.
Equity mining
In U.S. dealer practice, equity mining is the sales strategy of searching an existing customer base for owners whose vehicle is worth more than they still owe on it, and offering those owners a replacement. In a UK PCP, the matching figure is the equity above the GMFV.
Lease pull-ahead and loyalty programs from captive lenders
Some captive lenders reduce the cost of ending a lease for customers who take another vehicle from the same brand. Two programs, as checked on September 17, 2026:
| Program | What it waives | Condition | Geography | Source |
| Toyota Financial Services Encore | The disposition fee on the customer’s current lease | The customer leases or finances a new or certified used Toyota through a participating dealer within 30 days before or after the current lease ends | U.S. | Toyota Financial Services (checked September 17, 2026) |
| Volvo Car Financial Services Lease Pull-Ahead | Up to six remaining monthly lease payments and the standard vehicle turn-in fee | The customer leases or finances a new 2026 Volvo through Volvo Car Financial Services at the same time | U.S. | Description by an authorized Volvo dealer, April 2026 (checked September 17, 2026) |
The two programs illustrate the approach and do not describe the whole U.S. market. The size of leasing and captive finance in the U.S. new-vehicle market is shown in the finance table in the previous section.
Where does trade cycle management break down?
Trade cycle management breaks down when the customer has no equity, when residual values miss the market, when contact comes too late, when loans run long, when drivetrain preferences shift and when competing brands attract a customer lost at the trade-in point:
- Negative equity. In Q2 2026, 29.6% of U.S. trade-ins toward new-vehicle purchases carried negative equity, and the average amount owed reached $6,884, the highest for a second quarter on record, according to Edmunds (checked September 17, 2026).
- Residual values set for a different market. Bennett said residual values set three years earlier, around 2022, had assumed orderly market conditions that did not materialize; an owner who financed conventionally absorbed the loss, while a residual value plan left it with the finance company.
- Late or missing contact. A letter that arrives 90 days before the end of the contract, and the customers in the UK campaign who dropped off because nobody followed up, are both cases of contact that comes too late or not at all.
- Long loans. More than a third of new-vehicle loans in the U.S. ran longer than six years in Q1 2026, according to Experian, and a longer loan pushes back the point at which positive equity is likely to appear.
- A shift away from electric vehicles. The propensity of U.S. households returning to market with an EV to acquire another EV dropped 24 percentage points from September to November 2025, a shift S&P Global Mobility (May 2026) linked to the end of the federal EV tax credit in September 2025 (checked September 17, 2026).
- Competition for the customer who leaves (Europe). Tomasz Bogacki warned that a customer lost at the trade-in point can easily be attracted by Chinese brands with appealing prices, design and technology; Chinese brands alone took 9% of EU battery-electric car sales in 2025, according to ACEA’s May 2026 fact sheet citing S&P Global Mobility.
The concept of managing the customer ownership cycle holds regardless of where the car is manufactured or who its final owner is, Bennett said. In our reading, negative equity changes two of the three S’s: the customer reaches positive equity later or not at all, so the specific time and the specific message of the offer have to change with it.
Questions a dealer or lender can check in its own finance and service data
The conditions above translate into questions rather than benchmarks:
- For each active finance agreement, do you know the remaining term and an estimated equity position?
- Does the first offer reach the customer earlier than a letter 90 days before the contract ends?
- When you plan an offer, can you see whether the customer has serviced the vehicle at your dealership?
- Does the offer for a customer with negative equity differ in message and timing from the standard trade-in offer?
What does implementing trade cycle management on legacy systems involve?
Implementing trade cycle management on legacy systems involves a sequence of phases from planning to go-live, and the time frame depends on the legacy systems in place and the end goal, according to Tomasz Bogacki.
The phases are:
- planning
- assessments and blueprints
- system integration with the legacy systems
- development
- data migration
- testing
- go-live and documentation
The time frame also depends, Bogacki said, on how robust and how current the legacy systems are, how many changes need to be implemented, the resources available and the deadlines the customer wants to achieve.
Bennett concurred with that time frame, calling the work a “crawl, walk, run” approach.
On duration, Bogacki put such an implementation at anywhere between six months and a year and a half; six months would be very optimistic, though still doable with robust legacy systems and few changes to implement.
How do subscriptions and used-car lending fit into the trade cycle?
Bennett places subscription among financial products: a variation on daily rental or short-term leasing that sits in between, with a place of its own.
Subscription customers without a long-term commitment typically pay some euros more per month for something similar in exchange for flexibility, Bennett said, adding that he did not think subscription was “something to be scared of” and that retailers can benefit from it in some cases.
In his example, a dealer facing oversupply can put cars on one-, two- or three-month subscriptions and earn revenue before selling them with a few thousand kilometers instead of delivery mileage, though subscription had yet to establish itself.
Bennett also sees a largely untapped opportunity in trade cycle management for finance companies specializing in used cars, with major European banks showing considerable interest in retaining their used car customers.
Market figures cited in 2025, updated with data published through September 2026
Most of the market figures cited in 2025 held up against data published by September 17, 2026. The share of China-made cars in EU battery-electric car sales, given then as a forecast, did not reach the projected level, and some later data use different definitions, as noted under each table.
EU-China trade in battery-electric cars
Bennett cited data from ACEA, the European Automobile Manufacturers’ Association. ACEA’s fact sheet on EU-China vehicle trade in its May 2026 edition gives the 2025 values:
| Flow | Webinar (Paul Bennett, 2023 figures) | ACEA June 2024 edition (2023) | ACEA May 2026 edition (2025) |
| EU to China | About 11,500 electric vehicles exported from Europe, worth EUR 852 million | 11,499 battery-electric cars worth EUR 852.3 million | 1,936 EU-made battery-electric cars worth EUR 116 million |
| China to EU | 438,000 electric vehicles exported to Europe, worth EUR 9.7 billion | 438,034 battery-electric cars worth EUR 9.7 billion | 430,526 Chinese-made battery-electric cars worth EUR 6.3 billion |
The May 2026 edition counts EU-made and Chinese-made cars, a qualification the June 2024 edition does not use, so the 2023 and 2025 values are not a like-for-like series and no change between them is calculated here.
Share of China-made cars in EU battery-electric car sales
Bennett put electric vehicles manufactured in China as “setting to reach a quarter” of EU sales. The same share appears as a forecast in a March 2024 analysis by the environmental advocacy group Transport & Environment (T&E), which estimated that 19.5% of electric vehicles sold in Europe in 2023 were made in China and projected a share of 25% in 2024.
T&E also projected in March 2024 that Chinese brands could reach 11% of the European EV market in 2024 and 20% in 2027.
ACEA’s May 2026 fact sheet, citing S&P Global Mobility, gives the published shares for the EU:
| Year | Cars made in China, any brand | Chinese brands |
| 2021 | 19% | 2% |
| 2022 | 20% | 5% |
| 2023 | 22% | 8% |
| 2024 | 23% | 8% |
| 2025 | 20% | 9% |
Cars made in China accounted for 23% of EU battery-electric car sales in 2024 and 20% in 2025, according to ACEA’s May 2026 fact sheet citing S&P Global Mobility; T&E’s own tracking put the share at 17% in Q1 2026, down from a peak of 22% in 2024 by the same tracking.
EV battery makers’ global share
The battery makers’ shares cited in 2025 were CATL “just shy of 40%”, BYD at 17%, LG at 10% and another Chinese company at four and a half percent. SNE Research data for 2024 match those values, and the January-July 2026 figures show CATL gaining and BYD and LG Energy Solution losing share:
| Company | Webinar (slide) | January-December 2024 (SNE Research, released February 11, 2025) | January-July 2026 (SNE Research, released September 7, 2026; checked September 17, 2026) |
| CATL | Just under 40% | 37.9% | 39.9% (38.0% a year earlier) |
| BYD | 17% | 17.2% | 14.7% (16.9% a year earlier) |
| LG Energy Solution | 10% | 10.8% | 8.3% (9.6% a year earlier) |
| Fourth supplier | Another Chinese company, four and a half percent | CALB, 4.4%, in CnEVPost’s report on the release | Not reported in this release |
In January-July 2026, CATL held 39.9% of global EV battery usage and seven Chinese suppliers in the global top 10 held a combined 72.8%, up 3.1 percentage points year on year, according to SNE Research’s January-July 2026 battery usage figures, as of September 17, 2026.
China’s share of battery raw material refining
The International Energy Agency’s Global Critical Minerals Outlook 2026, published in July 2026, gives China’s shares of refining and supply for battery and magnet materials:
| Material | China’s share in 2025 | Comparison or projection | Geography | Source |
| Lithium refining output | 75% | 70% in 2024 | Global | International Energy Agency |
| Cobalt refining | More than 75% | Expected to remain broadly unchanged through the coming decade | Global | International Energy Agency |
| Battery-grade graphite supply | 94% | Projected 91% by 2035 | Global | International Energy Agency |
| Magnet rare-earth refining and separation | 85% | 90% in 2024; projected 73% by 2035 as new capacity ramps up in the United States and Malaysia | Global | International Energy Agency |
U.S. and Norway: electrification and trade rules
| Indicator | Value | Period | Geography | Source |
| Battery electric vehicles’ share of new light-duty vehicle sales | 6% (7% in Q2 2025) | Q2 2026 | U.S. | U.S. Energy Information Administration (checked September 17, 2026) |
| Hybrid, battery-electric and plug-in hybrid vehicles combined | 24% (22% in Q2 2025) | Q2 2026 | U.S. | U.S. Energy Information Administration (checked September 17, 2026) |
| Hybrid, battery-electric and plug-in hybrid vehicles combined | About 22% (20% in 2024); 2025 was the first year annual battery-electric sales and share declined | Full year 2025 | U.S. | U.S. Energy Information Administration |
| Additional Section 301 tariff on Chinese-made electric vehicles | 100%, in effect since September 2024 | As of September 17, 2026 | U.S. | Office of the United States Trade Representative, Federal Register |
| Rule on connected vehicles with certain hardware or software with a sufficient nexus to China or Russia | Software prohibitions from Model Year 2027; hardware prohibitions from Model Year 2030, or January 1, 2029 for units without a model year | Finalized January 2025 | U.S. | U.S. Department of Commerce, Bureau of Industry and Security |
| Battery-electric share of new passenger car sales | 98.7%; year to date January-August 2026: 97.8% | August 2026 | Norway | OFV (checked September 17, 2026) |
| Peak year of global sales of combustion-engine cars (cars other than battery-electric and plug-in hybrid models) | 2017 | Annual series | Global | Our World in Data, based on IEA Global EV Outlook data |
U.S. brand loyalty: the 2025 figure and J.D. Power’s studies
| Source | What it reported |
| Webinar (Tomasz Bogacki, citing a J.D. Power study from the previous year) | Some manufacturers had over 60% of customers returning to the same brand |
| J.D. Power 2024 U.S. Automotive Brand Loyalty Study, published September 25, 2024 | Four segment leaders above 60%: Ford among truck owners (65.1%), Honda among mass market SUV owners (64.2%), Toyota among mass market car owners (62.5%) and Lexus among premium SUV owners (60.2%); Porsche led premium car owners at 57.5% |
| J.D. Power 2025 U.S. Automotive Brand Loyalty Study, published September 24, 2025 | Segment leaders Ford (66.6%), Toyota (62.0%), Honda (62.0%), Porsche (58.2%) and Lexus (57.4%) |
For U.S. readers, competition from China-made vehicles takes a different form than in the EU, because the additional tariff and the connected vehicle rule in the table above apply there; the pressure on dealer retention in the U.S. is covered by the service and loyalty figures earlier in this article.
How was this material prepared?
This material is based on the webinar Automotive Restoration: Sustaining Growth and Revenue Security in Unpredictable Times, recorded on March 26, 2025 and published on YouTube on July 7, 2026 by Hicron Software, which also publishes this material. Paul Bennett spoke as a global expert in automotive finance; Tomasz Bogacki spoke for Hicron.
Market figures were refreshed to the most recent periods published by September 17, 2026, when the third quarter of 2026 had not yet ended, and every external figure was checked against its original source on that day.
Publishers that also sell data or software to the automotive trade are cited only as the source of a specific figure.
Sources
- Hicron Software, Automotive Restoration: Sustaining Growth and Revenue Security in Unpredictable Times [WEBINAR], July 7, 2026: https://www.youtube.com/watch?v=HEoQml1-hog
- Cox Automotive, New Cox Automotive Study Finds Dealerships Have Lost 12% of Service Visits to Competition Since 2018, November 11, 2025: https://www.coxautoinc.com/insights/new-cox-automotive-study-finds-dealerships-have-lost-12-of-service-visits-to-competition-since-2018/
- Google, Search results for trade cycle management (United States, English), accessed September 17, 2026: https://www.google.com/search?q=trade+cycle+management&hl=en&gl=us
- Hicron Software, Automotive Restoration: Sustaining Growth & Revenue Security in Unpredictable Times (Internet Archive copy of the webinar page), archived June 15, 2025: https://web.archive.org/web/20250615203135/https://hicronsoftware.com/resources/automotive-restoration-sustaining-growth-webinar/
- Finance & Leasing Association, Personal Contract Purchase (PCP), accessed September 17, 2026: https://www.financingyourcar.org.uk/car-finance-products/personal-contract-purchase-pcp
- Finance & Leasing Association, Latest Motor Finance Statistics, accessed September 17, 2026: https://fla.org.uk/research/motor-finance-statistics/
- Financial Conduct Authority, Technical Annex 2: State of Competition in the Motor Finance Market (CP25/27), October 7, 2025: https://www.fca.org.uk/publication/consultation/cp25-27-technical-annex-2.pdf
- MoneyHelper, Cut your car finance, hire purchase and other finance costs, accessed September 17, 2026: https://www.moneyhelper.org.uk/en/everyday-money/cut-your-car-finance-hire-purchase-and-other-finance-costs
- U.S. News & World Report, Car Brands With the Best Warranty Coverage in 2026, accessed September 17, 2026: https://cars.usnews.com/cars-trucks/advice/which-automaker-has-the-best-warranty
- Consumer Financial Protection Bureau, What should I know about leasing versus buying a car?, September 12, 2023: https://www.consumerfinance.gov/ask-cfpb/what-should-i-know-about-leasing-versus-buying-a-car-en-815/
- U.S. Department of Energy, Vehicle Technologies Office, FOTW #1190: Battery-Electric Vehicles Have Lower Scheduled Maintenance Costs than Other Light-Duty Vehicles, June 14, 2021: https://www.energy.gov/eere/vehicles/articles/fotw-1190-june-14-2021-battery-electric-vehicles-have-lower-scheduled
- OFV, 2025 ble tidenes rekordar for bilsalget, January 2, 2026: https://ofv.no/aktuelt/2025-ble-tidenes-rekordar-for-bilsalget
- Motor Trader, Steve Young Blog: Will BEVs kill the aftersales cash cow?, February 27, 2026: https://www.motortrader.com/motor-trader-news/automotive-news/steve-young-blog-will-bevs-kill-the-aftersales-cash-cow-27-02-2026
- J.D. Power, Satisfaction with Dealer Service Remains High but Owners Face Long Appointment Wait Times and Communication Shortfalls, J.D. Power Finds, March 13, 2025: https://www.businesswire.com/news/home/20250313701929/en/Satisfaction-with-Dealer-Service-Remains-High-but-Owners-Face-Long-Appointment-Wait-Times-and-Communication-Shortfalls-J.D.-Power-Finds
- Cox Automotive, 2025 Cox Automotive Service Industry Study, November 11, 2025: https://www.coxautoinc.com/wp-content/uploads/2025/10/2025-Service-Industry-Study-FINAL.pdf
- National Automobile Dealers Association, NADA Data 2025: Annual Financial Profile of America’s Franchised New-Car Dealerships, 2026: https://www.nada.org/media/4695/download?inline=
- Washington Area New Automobile Dealers Association, NADA Data, from gross profit to new-vehicle days supply, 2017: https://wanada.org/nada-data-from-gross-profit-to-new-vehicle-days-supply/
- J.D. Power, Brand Loyalty Faces Headwinds as Tariffs Reshape New-Vehicle Shopper Behavior, J.D. Power Finds, September 24, 2025: https://www.jdpower.com/business/press-releases/2025-us-automotive-brand-loyalty-study/
- S&P Global Mobility, Automotive Brand Loyalty Rates Show Mixed Results, August 28, 2025: https://press.spglobal.com/2025-08-28-Automotive-Brand-Loyalty-Rates-Show-Mixed-Results,-according-to-S-P-Global-Mobility
- LexisNexis Risk Solutions, Automotive Brand Loyalty Study, mid-year 2026, accessed September 17, 2026: https://risk.lexisnexis.com/insights-resources/research/brand-loyalty-mid-year-2026
- Experian, Hybrids Continue to Gain Ground Amid Elevated Gas Prices, According to a New Experian Automotive Report, August 27, 2026: https://www.experianplc.com/newsroom/press-releases/2026/hybrids-continue-to-gain-ground-amid-elevated-gas-prices–accord
- Experian, State of the Automotive Finance Market (Experian Insights articles), September 5, 2025: https://www.experian.com/blogs/insights/tag/state-of-the-automotive-finance-market/
- Experian, New Experian Automotive report shows nearly one-third of automotive loan terms are longer than six years, May 28, 2026: https://www.experianplc.com/newsroom/press-releases/2026/new-experian-automotive-report-shows-nearly-one-third-of-automot
- Experian, Average Car Payment in 2026, September 10, 2026: https://www.experian.com/blogs/ask-experian/average-car-payment/
- Google, Search results for equity mining (United States, English), accessed September 17, 2026: https://www.google.com/search?q=equity+mining&hl=en&gl=us
- Toyota Financial Services, Repeat Customers, accessed September 17, 2026: https://www.toyotafinancial.com/us/en/financing_options/rebate_finance_programs/repeat_customers.html
- Ramsey Volvo, How Does the Volvo Lease Pull Ahead Program Work?, April 14, 2026: https://www.volvocarsramsey.com/blog/2026/april/14/volvo-lease-pull-ahead-eligibility-rules-ramsey-volvo-htm.htm
- Edmunds, Q2 New-Vehicle Purchases with Negative Equity Trade-Ins Hit Record Monthly Payments and Interest Costs, Edmunds Reports, July 16, 2026: https://www.edmunds.com/industry/press/q2-new-vehicle-purchases-with-negative-equity-trade-ins-hit-record-monthly-payments-and-interest-costs-edmunds-reports.html
- S&P Global Mobility, Return-to-market EV households are increasingly migrating to gas-powered vehicles, May 18, 2026: https://www.spglobal.com/automotive-insights/en/blogs/2026/05/electric-vehicle-owners-migrating-to-gasoline-vehicles
- ACEA, Fact sheet: EU-China vehicle trade, May 2026 edition, May 4, 2026: https://www.acea.auto/files/ACEA-fact-sheet_EU-China-vehicle-trade_May-2026.pdf
- ACEA, Fact sheet: EU-China vehicle trade (June 2024 edition), June 12, 2024: https://www.acea.auto/fact/fact-sheet-eu-china-vehicle-trade-2024/
- Transport & Environment, One in four EVs sold in Europe this year will be made in China – analysis, March 27, 2024: https://www.transportenvironment.org/articles/one-in-four-evs-sold-in-europe-this-year-will-be-made-in-china-analysis
- Transport & Environment, The presence of Chinese automakers in the EU car market, July 13, 2026: https://www.transportenvironment.org/articles/presence_chinese_automakers_eu_car_market
- CnEVPost, Global EV battery market share in 2024: CATL 37.9%, BYD 17.2%, February 11, 2025: https://cnevpost.com/2025/02/11/global-ev-battery-market-share-2024/
- SNE Research, January-July 2026 Global EV Battery Usage Reaches 725.2 GWh, September 7, 2026: https://www.sneresearch.com/en/insight/release_view/727/page/0
- International Energy Agency, Global Critical Minerals Outlook 2026, July 16, 2026: https://www.iea.org/reports/global-critical-minerals-outlook-2026
- U.S. Energy Information Administration, Hybrid sales rise while battery electric sales remain lower after tax credit expiration, July 27, 2026: https://www.eia.gov/todayinenergy/detail.php?id=67885
- U.S. Energy Information Administration, Electric vehicle sales fell as hybrid vehicle sales continued to rise in 2025, February 9, 2026: https://www.eia.gov/todayinenergy/detail.php?id=67144
- Office of the United States Trade Representative, Notice of Modification: China’s Acts, Policies and Practices Related to Technology Transfer, Intellectual Property, and Innovation, September 18, 2024: https://www.federalregister.gov/documents/2024/09/18/2024-21217/notice-of-modification-chinas-acts-policies-and-practices-related-to-technology-transfer
- U.S. Department of Commerce, Bureau of Industry and Security, Commerce Finalizes Rule to Secure Connected Vehicle Supply Chains from Foreign Adversary Threats, January 14, 2025: https://www.bis.gov/press-release/commerce-finalizes-rule-secure-connected-vehicle-supply-chains-foreign-adversary-threats
- OFV, Personbilsalget gar tilbake – seks av de ti storste merkene vokser, September 1, 2026: https://ofv.no/aktuelt/personbilsalget-gar-tilbake-seks-av-de-ti-storste-merkene-vokser
- Our World in Data, Global sales of combustion engine cars peaked in 2017, May 21, 2026: https://ourworldindata.org/data-insights/global-sales-of-combustion-engine-cars-peaked-in-2017
- J.D. Power, As Inventory Levels Recover, Loyal Customers Returning to Their Brand of Choice, J.D. Power Finds, September 25, 2024: https://www.jdpower.com/business/press-releases/2024-us-automotive-brand-loyalty-study
Testimonials
Hicron Software proved to be a trusted partner with unmatched technical expertise, delivering a scalable and user-friendly web application that was pivotal to our successful U.S. market expansion.

Hicron’s contributions have been vital in making our product ready for commercialization. Their commitment to excellence, innovative solutions, and flexible approach were key factors in our successful collaboration.
I wholeheartedly recommend Hicron to any organization seeking a strategic long-term partnership, reliable and skilled partner for their technological needs.

After carefully evaluating suppliers, we decided to try a new approach and start working with a near-shore software house. Cooperation with Hicron Software House was something different, and it turned out to be a great success that brought added value to our company.
With HICRON’s creative ideas and fresh perspective, we reached a new level of our core platform and achieved our business goals.
Many thanks for what you did so far; we are looking forward to more in future!

Hicron is a partner who has provided excellent software development services. Their talented software engineers have a strong focus on collaboration and quality. They have helped us in achieving our goals across our cloud platforms at a good pace, without compromising on the quality of our services. Our partnership is professional and solution-focused!

The IT system supporting the work of retail outlets is the foundation of our business. The ability to optimize and adapt it to the needs of all entities in the PSA Group is of strategic importance and we consider it a step into the future. This project is a huge challenge: not only for us in terms of organization, but also for our partners – including Hicron – in terms of adapting the system to the needs and business models of PSA. Cooperation with Hicron consultants, taking into account their competences in the field of programming and processes specific to the automotive sector, gave us many reasons to be satisfied.

Get in touch
