10 Real Estate Software Development Companies in 2026
- February 03
- 9 min


Automated variance notes are AI-generated explanations for differences between budgeted and actual costs in financial reports. This technology streamlines reporting by automatically analyzing data to explain why variances occurred. This article explains the problems with manual variance analysis and shows how automated reporting tools can lead to faster, more accurate financial insights.
Key Takeaways:
For many finance teams, the month-end close is a stressful time defined by long hours and tedious tasks. One of the biggest challenges is manual variance analysis. This process involves comparing budgeted figures to actual spending, identifying discrepancies, and then writing notes to explain them. It is a necessary but often inefficient part of financial reporting.
The process is a major time and resource drain. Team members spend hours sifting through
to find the reasons behind a budget overrun. This manual investigation pulls skilled professionals away from more strategic work, like forecasting and analysis. The work is repetitive and offers little value beyond fulfilling a reporting requirement.
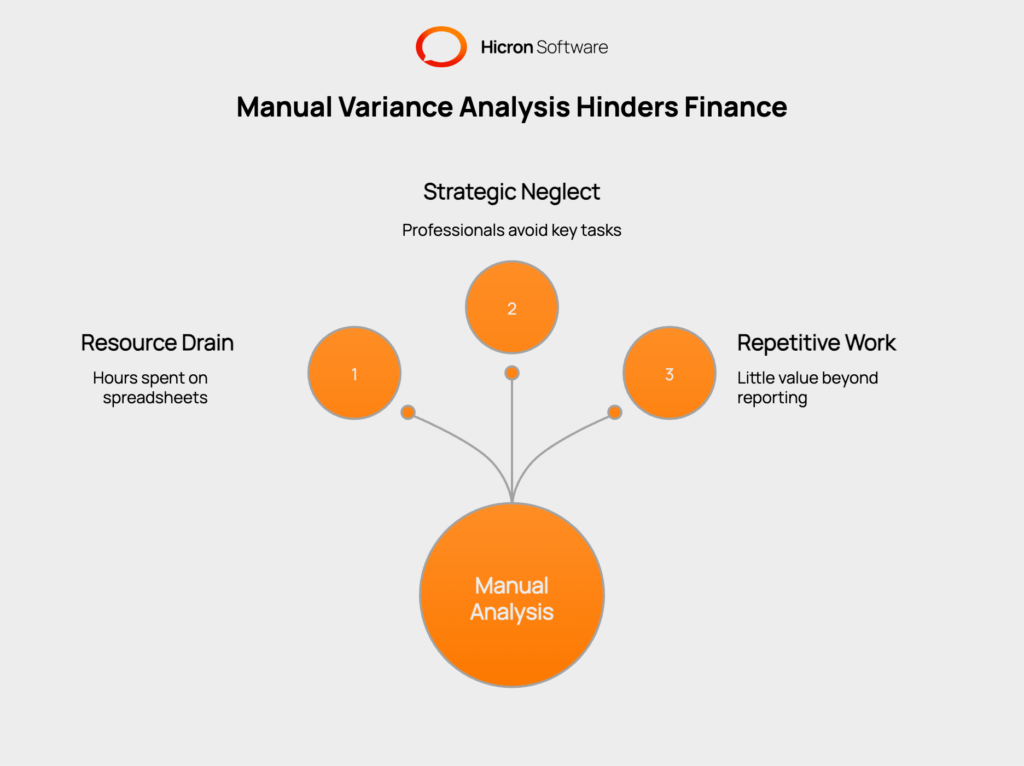
This manual approach also carries a high risk of human error. The explanations for variances can be inconsistent from one report to the next. Different people may interpret the same data differently, leading to subjective commentary. Important details can be missed, resulting in inaccurate or incomplete reports that give a flawed view of financial health. This also causes delays, creating a bottleneck that prevents management from getting timely information to make decisions.
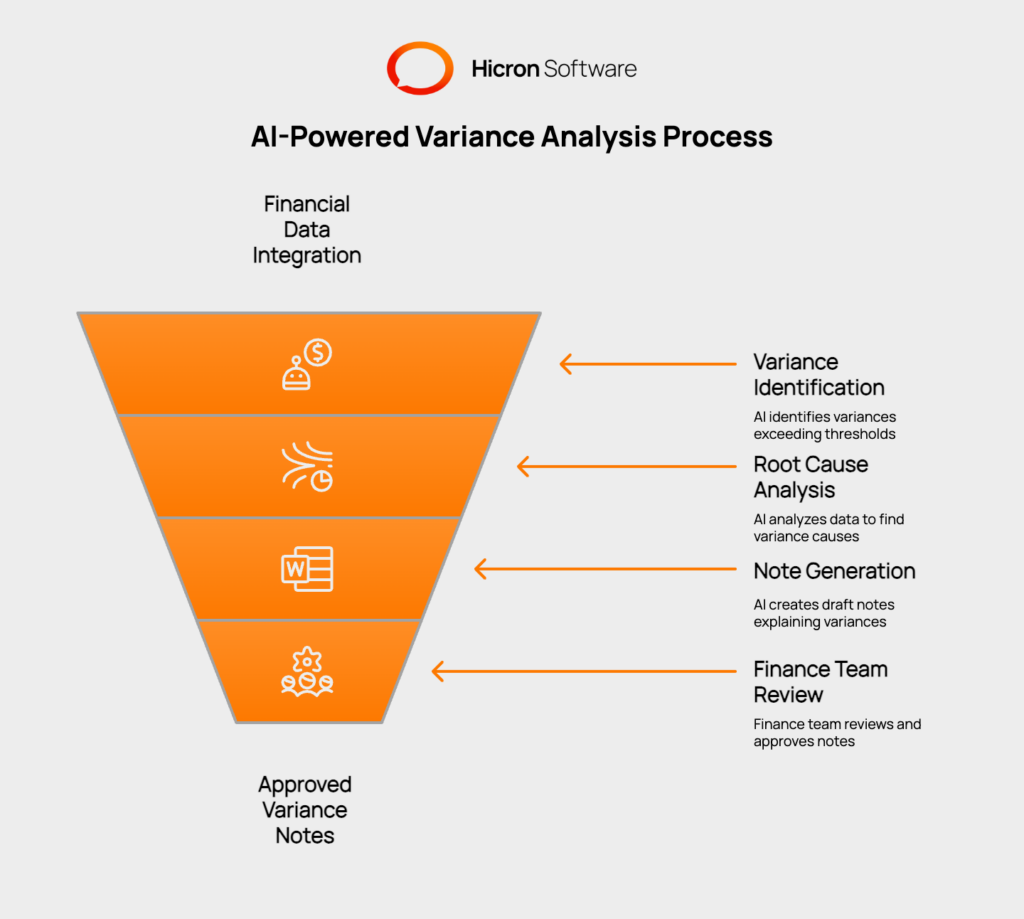
AI-powered variance analysis offers a direct solution to the problems of manual reporting. These automated reporting tools integrate with your existing financial systems to pull job cost data, invoices, and budget information. Instead of a person digging through records, the software does the heavy lifting. It uses artificial intelligence to automatically identify variances and explain them.
The core of this technology is its ability to create clear, human-like variance notes using a function called natural language generation (NLG). The process is straightforward.
For example, it might produce a note that reads: “Project X is $5,000 over budget due to a 15% increase in material costs from Vendor Y, as seen on invoice #12345.” This draft is then presented to the finance team for a quick review and approval. The entire process transforms a multi-hour task into a matter of minutes.
Adopting automated variance notes provides immediate and measurable benefits for any organization. The most obvious advantage is the drastic reduction in manual effort. By automating the time-consuming task of data investigation and note writing, finance teams are freed up. They can focus their expertise on strategic analysis and forward-looking financial planning instead of getting stuck in repetitive reporting tasks. This directly accelerates the month-end close process.
Accuracy and consistency also improve dramatically. Automated systems apply the same logic every time, eliminating the subjective and inconsistent commentary that comes from manual analysis. Every variance is explained with data-backed reasons, ensuring that reports are objective and reliable. This builds trust in the financial numbers across the entire organization.
Ultimately, this leads to faster, more insightful reporting. With automation, variance explanations can be generated in near real-time. Management no longer has to wait days or weeks for a report to be finalized. They receive timely information that allows them to make quicker, better-informed decisions. This streamlined financial reporting helps the business operate with more agility.
The value of AI-powered variance analysis is clear in industries with complex project costs, such as construction and property management. In construction project management, cost overruns are common. An automated tool can instantly explain budget deviations by linking them to specific material invoices, unexpected labor charges, or subcontractor fees. Project managers get immediate insights, allowing them to address issues before they escalate.
In property management, these tools are used to generate variance notes for property-level operating expenses. A system can analyze utility costs across a portfolio and automatically flag a building with unusually high energy spending. It can then trace the cause to a specific meter reading or invoice. This helps property managers control costs and improve the financial performance of their assets. These practical applications show how automation turns financial data into actionable business intelligence.
|
Industry |
Use Case |
How Automation Helps |
|
Construction Project Management |
Explaining project cost overruns. |
An automated tool instantly analyzes job cost data to link budget deviations to specific material invoices, unexpected labor charges, or subcontractor fees. This gives project managers immediate insights to address issues before they escalate. |
|
Property Management |
Generating variance notes for property-level operating expenses. |
A system automatically analyzes utility costs or maintenance spending across a portfolio, flags properties with unusual expenses, and traces the variance to a specific invoice or work order. This helps managers control costs and improve asset performance. |
|
Manufacturing |
Analyzing production cost variances. |
The tool compares actual production costs against standard costs, automatically identifying the root cause of variances, such as increased raw material prices, labor inefficiencies, or machine downtime, and generating an explanation. |
|
Corporate Finance |
Streamlining departmental budget reporting (e.g., IT, HR, Sales). |
The system automatically generates notes explaining why a department’s spending deviated from its budget, tracing it to specific line items like software subscriptions, travel expenses, or overtime pay, speeding up the overall close process. |
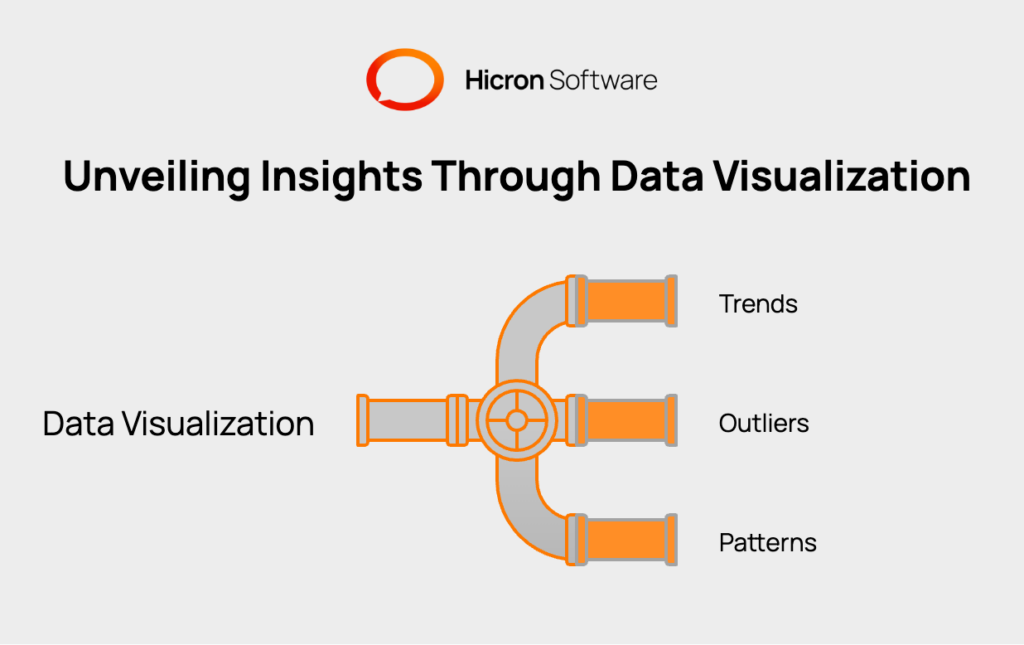
Data visualization tools further enhance financial reporting by transforming complex datasets into clear, intuitive visuals. These platforms convert rows of numbers into easily understandable charts, graphs, and interactive dashboards, which allows stakeholders to quickly identify
By presenting financial information in a visual format, these tools make the data more accessible and easier to interpret for individuals at all levels of an organization. This clarity accelerates comprehension and empowers leaders to make faster, more confident decisions based on actionable insights rather than raw data.
Building data visualization in automated variance reporting involves a combination of tools and technologies designed to process, analyze, and visually present financial data. Here are the key components.
|
Component |
Purpose |
Examples |
|
Data Integration Tools |
To connect and aggregate data from multiple sources like ERP systems, accounting software, and databases. |
ETL (Extract, Transform, Load) tools like Talend, Apache Nifi, or Microsoft Power Query. |
|
Data Processing & Analytics |
To process raw data, perform variance analysis, and generate insights before visualization. |
Python (with libraries like Pandas and NumPy), R, or SQL-based analytics platforms. |
|
Visualization Libraries & Frameworks |
To create interactive and custom charts, graphs, and dashboards from the processed data. |
D3.js, Chart.js, Plotly, or Matplotlib for custom development. |
|
Business Intelligence (BI) Tools |
To provide user-friendly, no-code/low-code platforms for creating and sharing dashboards and reports. |
Tableau, Microsoft Power BI, QlikView, or Looker. |
|
AI & Machine Learning Models |
To enhance variance analysis by identifying complex patterns, anomalies, and predictive trends in data. |
TensorFlow, Scikit-learn, or pre-built AI models integrated into modern BI tools. |
|
Natural Language Processing (NLP) |
To convert unstructured text data (e.g., emails, notes) into structured insights for visualization. |
spaCy, Google Cloud Natural Language API, or other NLP libraries. |
|
Cloud Computing Platforms |
To store, process, and serve large datasets, enabling scalable and real-time data visualization. |
AWS (Amazon QuickSight), Google Cloud (BigQuery), or Microsoft Azure. |
|
APIs & Data Connectors |
To facilitate the automated flow of data between different systems and visualization tools. |
REST APIs, GraphQL, or pre-built connectors available within most BI tools. |
|
Interactive Dashboard Features |
To allow end-users to explore data dynamically by drilling down into specific points and customizing views. |
Filters, slicers, and drill-down functionalities built into tools like Tableau or Power BI. |
|
Data Governance & Security |
To ensure data accuracy, manage compliance, and control secure access to sensitive financial information. |
Data cataloging tools like Alation and security frameworks like OAuth or SAML. |
Manual variance reporting has long been a source of inefficiency for finance teams. The process is slow, prone to human error, and pulls skilled professionals away from high-value strategic work. This traditional approach creates reporting bottlenecks, delivering outdated information that hampers effective decision-making.
AI-powered variance analysis directly addresses these challenges. By automating the investigation and explanation of budget deviations, these tools save countless hours of manual work. The result is not only accelerated reporting cycles but also improved accuracy and consistency in financial commentary. This provides leaders with the timely, data-backed insights needed to guide the business effectively.
Adopting automated reporting tools is a critical step toward building a more efficient and data-driven finance function. Moving beyond manual methods allows your team to focus on forward-looking analysis instead of backward-looking justification. Embracing this technology helps create a more agile and competitive organization. Contact us to discuss the process further.
Variance notes are written explanations in a financial report that describe why an actual cost differed from the budgeted amount. They provide context for financial performance.
AI uses natural language generation (NLG). It analyzes financial data to find the cause of a variance and then constructs a human-like sentence or paragraph explaining the finding.
Modern automated reporting tools are often designed to integrate easily with common accounting and ERP systems, making implementation much simpler than in the past.
No. It automates the repetitive, low-value tasks, freeing up finance professionals to focus on higher-level strategic analysis, review, and decision-making.
The primary benefit is speed. It drastically shortens the reporting cycle, giving decision-makers faster access to crucial financial insights while also improving accuracy.
Hicron Software proved to be a trusted partner with unmatched technical expertise, delivering a scalable and user-friendly web application that was pivotal to our successful U.S. market expansion.

Hicron’s contributions have been vital in making our product ready for commercialization. Their commitment to excellence, innovative solutions, and flexible approach were key factors in our successful collaboration.
I wholeheartedly recommend Hicron to any organization seeking a strategic long-term partnership, reliable and skilled partner for their technological needs.

After carefully evaluating suppliers, we decided to try a new approach and start working with a near-shore software house. Cooperation with Hicron Software House was something different, and it turned out to be a great success that brought added value to our company.
With HICRON’s creative ideas and fresh perspective, we reached a new level of our core platform and achieved our business goals.
Many thanks for what you did so far; we are looking forward to more in future!
Hicron is a partner who has provided excellent software development services. Their talented software engineers have a strong focus on collaboration and quality. They have helped us in achieving our goals across our cloud platforms at a good pace, without compromising on the quality of our services. Our partnership is professional and solution-focused!

The IT system supporting the work of retail outlets is the foundation of our business. The ability to optimize and adapt it to the needs of all entities in the PSA Group is of strategic importance and we consider it a step into the future. This project is a huge challenge: not only for us in terms of organization, but also for our partners – including Hicron – in terms of adapting the system to the needs and business models of PSA. Cooperation with Hicron consultants, taking into account their competences in the field of programming and processes specific to the automotive sector, gave us many reasons to be satisfied.
