Modern Fleet Management Applications: Mobile-first Solutions Guide
- August 19
- 22 min


The fleet management dashboard UI is the central command center for fleet operations, transforming vast amounts of raw data into strategic intelligence. It is the primary interface where managers monitor vehicle locations, track performance, and optimize daily activities. An effective UI is the difference between being buried in spreadsheets and making quick, informed decisions from a single screen.
This expert guide will break down the essential elements of effective fleet management dashboard UI design. We will explore the critical features that empower managers, the UI/UX best practices that ensure clarity, and how a well-designed dashboard provides actionable insights for total fleet oversight.
Key Takeaways
To truly support operations managers, a dashboard must include a specific set of features that provide a comprehensive view of the entire fleet. These components are the building blocks of an effective fleet management system UI.
|
Feature Name |
Description |
Key Benefits |
|
Live Map & Geofencing View |
Provides real-time vehicle location tracking on an interactive map. Allows users to create virtual boundaries (geofences) and receive alerts when vehicles enter or exit them. |
|
|
Fleet Health & Security Dashboards |
Displays at-a-glance widgets for critical metrics like vehicle online/offline status, engine diagnostic codes (DTCs), and driver safety scores. Monitors for security events. |
|
|
Dedicated Fleet Maintenance Dashboard |
Tracks upcoming preventative maintenance schedules, manages repair orders, and logs service history and costs for each vehicle. |
|
|
Performance & KPI Widgets |
Offers customizable widgets for key performance indicators (KPIs) such as fuel efficiency, idle time, on-time performance, and asset utilization rates. |
|
The cornerstone of any fleet dashboard is the live map. This feature provides real-time location tracking for every vehicle on an interactive display. Managers can see exactly where their assets are, monitor trip progress, and identify any deviations from the planned route. The map should also support geofencing, allowing users to create virtual boundaries around specific locations and receive instant alerts when a vehicle enters or exits an area. These are dashboard features that support operations managers in fleet oversight by providing immediate spatial context.
At-a-glance widgets for fleet health are critical for proactive management. Dashboards for fleet health and security levels should display vital metrics such as the number of vehicles currently online or offline, active engine diagnostic trouble codes (DTCs), and driver safety scores. This component should also monitor security events, sending alerts for potential issues like unauthorized vehicle use or device tampering, ensuring assets are always protected.
A dedicated fleet maintenance dashboard is essential for keeping vehicles on the road and out of the shop unexpectedly. This module tracks upcoming preventative maintenance based on mileage, engine hours, or calendar dates. It also helps manage repair orders, provides access to complete service history logs, and allows for tracking maintenance costs per vehicle. This focused view helps reduce downtime and control repair expenses.
Customizable widgets for key performance indicators (KPIs) allow managers to focus on the metrics that matter most to their operation. A good fleet management dashboard UI example would include widgets for fuel efficiency, idle time, on-time performance, and asset utilization rates. These visuals provide a quick, high-level analysis of performance, helping managers spot trends and identify areas for improvement.
A great fleet management dashboard UI is defined by its usability. Following user experience (UX) and user interface (UI) best practices ensures the dashboard is powerful and easy to use.
|
Best Practice |
Description |
Key Benefits |
|
Clean, Data-First Layout |
Focuses on presenting data clearly by avoiding clutter. It uses a strong visual hierarchy with elements like cards, modules, and whitespace to organize information logically. |
|
|
Mobile-First Design |
Involves creating a responsive design that adapts to any screen size, from desktop to tablet to smartphone, ensuring a consistent and functional experience on all devices. |
|
|
Focus on Actionable Insights |
Highlights what needs attention rather than just displaying data. This is achieved using visual cues like color-coding and trend indicators, with an easy way to drill down for more details. |
|
|
Partner with UI/UX Design Services |
Involves engaging specialists who understand the unique workflows and demands of fleet operations to create a powerful, user-centered, and industry-tailored final product. |
|
The primary goal of the fleet management system UI is to present data clearly. Avoid a cluttered interface by using a clean layout that guides the user’s eye to the most critical information first. A strong visual hierarchy, created with elements like cards, modules, and sufficient whitespace, helps organize information logically. This makes the dashboard scannable and allows managers to assess the situation quickly.
How can mobile-friendly dashboards improve fleet visibility? They untether managers from their desks. Mobile-first fleet dashboard and control solutions allow managers to track assets, respond to urgent alerts, and make critical decisions from a smartphone or tablet. This requires a responsive design that automatically adapts to any screen size, providing a consistent and functional experience whether on a desktop computer or a mobile device.
Effective fleet health dashboards with actionable insights do more than just display numbers; they highlight what needs attention. Use intuitive visual cues like color-coding (red for urgent alerts, green for normal status) and trend indicators to draw attention to important events. The UI should also make it easy for a user to drill down from a high-level KPI on the dashboard to the specific vehicle or event that requires further investigation.
Creating a user-centered design that meets the unique demands of fleet operations is a specialized skill. Partnering with professional fleet management UI/UX design services can provide valuable expertise. These specialists understand the workflows of operations managers, the importance of compliance, and the nuances of driver behavior, ensuring the final product is both powerful and perfectly tailored to the industry.
The fleet management dashboard UI design process is a structured journey that transforms operational needs into a functional, user-friendly interface. It begins with comprehensive user research to understand the specific requirements of fleet managers, followed by wireframing to map out the basic layout and information architecture. This blueprint for fleet management software UI evolves into interactive prototyping, allowing stakeholders to test the user flow and provide feedback before development.
|
Step |
Description |
Purpose/Benefit |
|
User Research |
Interviews, surveys, and observation to identify goals, pain points, and workflows of fleet managers and end-users. |
Ensures the dashboard meets real-world needs and specific user requirements. |
|
Wireframing |
Creation of low-fidelity blueprints outlining layout and information architecture. |
Allows early feedback on structure and usability before visual design. |
|
Prototyping |
Development of interactive, high-fidelity models to simulate user experience and gather feedback. |
Enables testing of user flow and validation of design choices before full development. |
The final fleet management app design is brought to life using modern technologies, including responsive web design frameworks like React or Angular for multi-device access. Data is fed to the dashboard through APIs, while powerful data visualization libraries such as D3.js or Chart.js are used to render complex fleet metrics into clear, actionable charts and graphs.
|
Technology |
Description |
Purpose/Benefit |
|
APIs |
Application Programming Interfaces that connect the dashboard to backend systems for real-time data access. |
Provide accurate, live data to the interface for operational decision-making. |
|
Responsive Frameworks |
Front-end frameworks like React or Angular used to build adaptable, device-agnostic interfaces. |
Deliver a consistent and functional experience across desktops, tablets, and smartphones. |
|
Data Visualization Libraries |
Tools such as D3.js or Chart.js for rendering charts, graphs, and maps. |
Convert complex fleet metrics and large datasets into clear, actionable visual representations. |
The benefits of a well-executed fleet management dashboard UI design extend directly to the bottom line. By connecting design to tangible business outcomes, its value becomes clear.
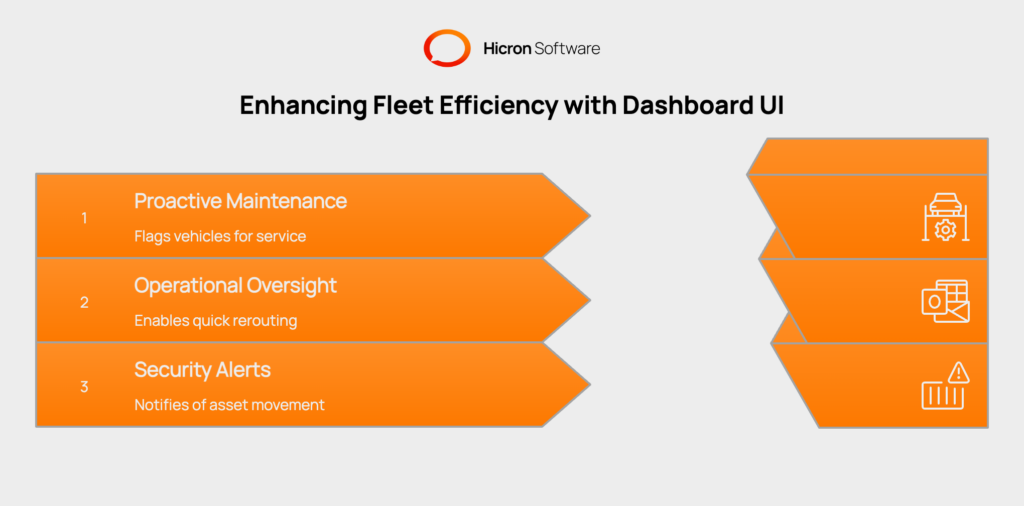
A proactive approach to management saves time and money. For example, a fleet maintenance dashboard automatically flags a vehicle approaching its service interval based on high engine hours. This allows a manager to schedule maintenance before a costly and disruptive breakdown occurs on the road.
Real-time visibility empowers managers to respond to issues as they happen. An operations manager using a mobile-first fleet dashboard can see an unexpected traffic jam on the live map and instantly reroute a driver. This quick action helps ensure an on-time delivery and maintains customer satisfaction.
Dashboards are a key tool for asset protection. A security alert can appear on the dashboard notifying a manager of after-hours movement of a high-value asset. This instant notification allows the manager to verify the vehicle’s status and contact authorities if necessary, preventing potential theft.
Investing in a great fleet management dashboard UI design is an investment in operational control. Fleet management app design provides the clear, actionable information needed to run a modern fleet successfully and efficiently. Get in touch to modernize or develop a solution tailored to your business needs, including fleet management dashboards and software.
A fleet management dashboard UI (User Interface) is the visual front-end of a fleet management system. It’s an interactive screen that displays key data like vehicle locations, maintenance schedules, and performance metrics in an easy-to-understand format.
The most important features include a live map with geofencing, dashboards for fleet health and security levels, a dedicated fleet maintenance dashboard, and customizable widgets for key performance indicators (KPIs).
Mobile-friendly dashboards allow managers to access real-time data and receive alerts on their smartphones or tablets. This means they can monitor operations, make decisions, and respond to issues from anywhere, not just from behind a desk.
These are dashboards designed to do more than just show data. They use visual cues like color-coding and alerts to highlight what needs immediate attention and allow users to drill down into the data to understand the root cause of an issue.
Professional UI/UX designers specializing in fleet management understand the specific needs and workflows of the industry. They can create a dashboard that is not only visually appealing but also highly functional and intuitive for operations managers and other users.
Hicron Software proved to be a trusted partner with unmatched technical expertise, delivering a scalable and user-friendly web application that was pivotal to our successful U.S. market expansion.

Hicron’s contributions have been vital in making our product ready for commercialization. Their commitment to excellence, innovative solutions, and flexible approach were key factors in our successful collaboration.
I wholeheartedly recommend Hicron to any organization seeking a strategic long-term partnership, reliable and skilled partner for their technological needs.

After carefully evaluating suppliers, we decided to try a new approach and start working with a near-shore software house. Cooperation with Hicron Software House was something different, and it turned out to be a great success that brought added value to our company.
With HICRON’s creative ideas and fresh perspective, we reached a new level of our core platform and achieved our business goals.
Many thanks for what you did so far; we are looking forward to more in future!
Hicron is a partner who has provided excellent software development services. Their talented software engineers have a strong focus on collaboration and quality. They have helped us in achieving our goals across our cloud platforms at a good pace, without compromising on the quality of our services. Our partnership is professional and solution-focused!

The IT system supporting the work of retail outlets is the foundation of our business. The ability to optimize and adapt it to the needs of all entities in the PSA Group is of strategic importance and we consider it a step into the future. This project is a huge challenge: not only for us in terms of organization, but also for our partners – including Hicron – in terms of adapting the system to the needs and business models of PSA. Cooperation with Hicron consultants, taking into account their competences in the field of programming and processes specific to the automotive sector, gave us many reasons to be satisfied.
