September 12
14 min


Definition: Custom dashboards for large-scale PropTech are bespoke command centers that consolidate vast, complex data streams from entire portfolios into a single, intuitive interface. They are designed to integrate data from systems like IoT devices, ESG compliance trackers, and building management systems, providing actionable insights for enterprise-level real estate operations.
This article explores the role dashboards play in managing large-scale operations. It will explore their benefits, essential features, design best practices, and applications across various industries such as smart cities, commercial real estate, and logistics, highlighting how they enable strategic oversight and data-driven decision-making.
At its core, a custom dashboard for large-scale PropTech is a centralized, visual command center. It is engineered to aggregate, process, and display critical data from across a vast real estate portfolio. Unlike off-the-shelf software, these dashboards are built specifically to handle the unique scale, systems, and strategic goals of an enterprise.
They integrate everything from financial metrics and operational alerts to ESG compliance tracking and smart city data, presenting it all in a digestible format.
Adopting a custom dashboard solution moves an organization from being data-rich but insight-poor to being truly data-driven. The benefits are felt across every level of the enterprise.
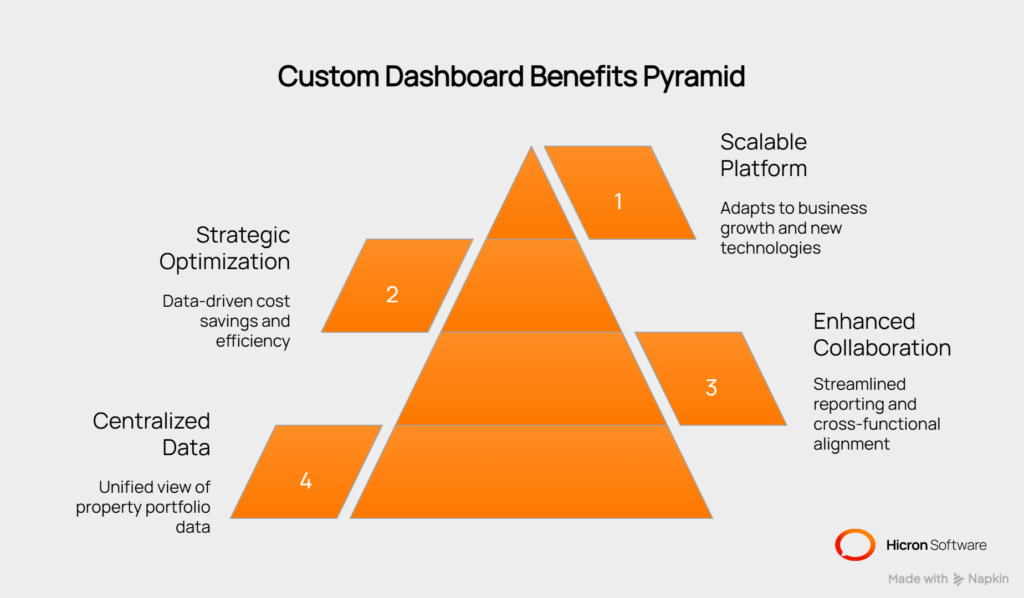
The most immediate benefit is the elimination of information silos. These dashboards aggregate data from multiple properties and locations into one unified view.
For example, a property manager can track occupancy rates, rental income, and energy usage across an entire portfolio of buildings in real-time, pinpointing underperforming assets and identifying opportunities for improvement.
This breaks down walls between departments, such as finance, operations, and leasing, fostering a more cohesive strategy.
With a single source of truth, collaboration becomes better. Cross-functional teams can access and share the same data, ensuring everyone is aligned. In a smart city context, dashboards can display city-wide metrics such as traffic flow, public utility usage, or air quality, allowing multiple municipal departments to coordinate their efforts.
Furthermore, they can automate the generation of customized reports for stakeholders, investors, and regulatory bodies, saving countless hours and reducing human error.
By analyzing data from across a portfolio, managers can identify clear opportunities for cost savings. This could involve pinpointing buildings with high energy consumption or finding operational inefficiencies that can be corrected.
The data-driven insights from dedicated dashboards help businesses make informed decisions on capital expenditures and preventative maintenance schedules, leading to better long-term cost management.
An enterprise portfolio is a living entity—it grows, shrinks, and evolves. A custom dashboard is built on a flexible architecture that adapts to this constant change.
Whether you are acquiring new properties, integrating new IoT technologies, or expanding into new markets, a scalable dashboard can easily incorporate these new data sources without a dip in performance, future-proofing your investment.
Not all dashboards are created equal. An effective enterprise-grade solution must include features designed to handle complexity and deliver actionable intelligence.
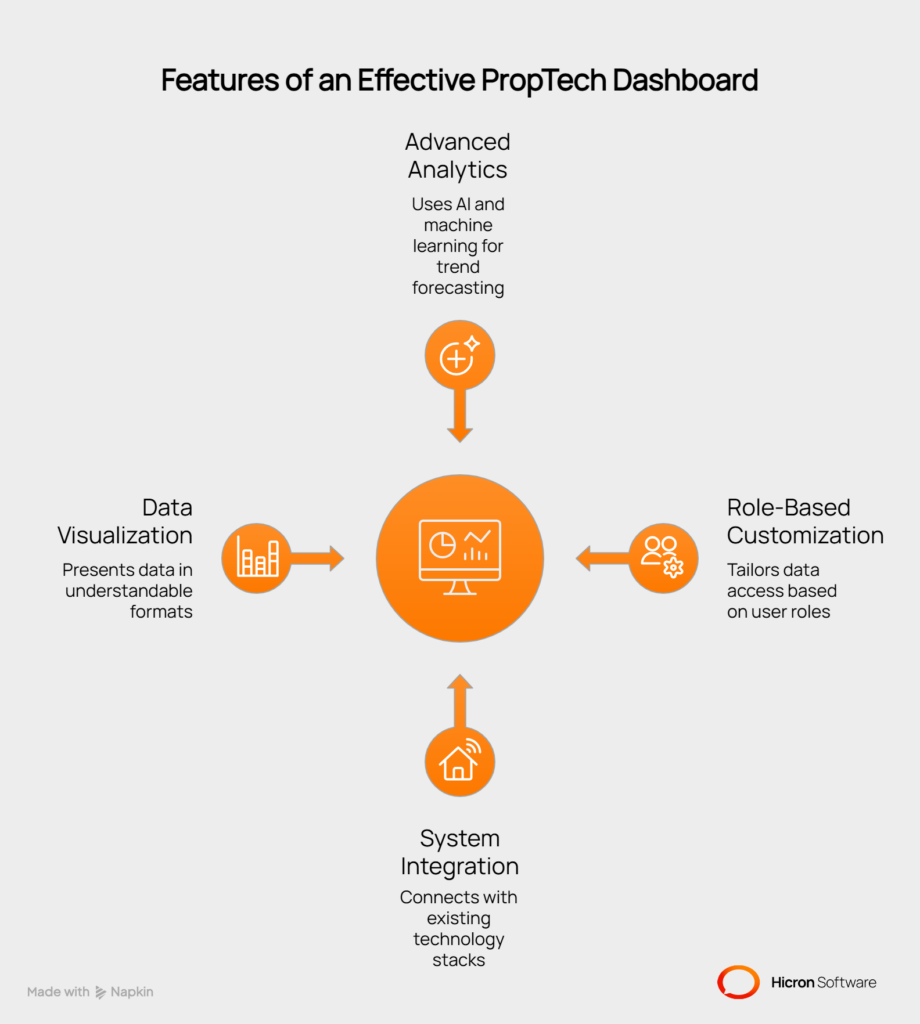
Modern dashboards go beyond historical reporting. They incorporate AI and machine learning for trend forecasting, predicting future occupancy rates, energy usage, or market rental rates. They can also provide scenario modeling tools that allow executives to assess the financial and operational impact of potential strategic decisions, such as a major capital improvement project.
Different roles require different information. A CEO needs a high-level overview of portfolio ROI and risk, while a facility manager needs granular data on equipment performance. A powerful dashboard offers granular, permission-based access and allows users to create and save personalized views with the KPIs and widgets most relevant to their responsibilities.
A dashboard’s value is directly tied to its ability to connect with your existing technology stack. Look for solutions offering native integration with essential software like Building Management Systems (BMS), ERPs, and financial platforms. This also includes connecting to IoT sensor networks and other operational technologies to pull in real-time data from the ground up.
Data is only helpful if it can be understood. Advanced visualization tools are important for making sense of complex datasets. This includes geospatial mapping of large property portfolios for real-time asset tracking, interactive charts for drilling down into performance metrics, and live KPI tracking for portfolio-wide energy consumption, asset health, and tenant satisfaction.
The system should also support automated alerts for critical events, such as equipment malfunctions or security breaches.
The applications of custom dashboards are as varied as the portfolios they manage. They provide tailored solutions that empower enterprises to address specific challenges and opportunities within their domains.
| Use Case | Example |
| Managing commercial real estate portfolios | Monitoring lease expirations, tenant satisfaction, and financial performance across hundreds of properties. Dashboards help managers track occupancy rates, visualize revenue trends, and identify areas needing capital improvements. |
| Powering smart city and urban development | Tracking city-wide metrics like energy grid performance, traffic flow, and public utility usage to improve urban planning. Administrators use dashboards to view real-time data from IoT sensors, enabling timely infrastructure decisions. |
| Optimizing industrial and logistics facilities | Overseeing asset performance, supply chain logistics, and maintenance schedules across a global network of warehouses. Dashboards provide real-time visibility into equipment status, inventory levels, and shipments. |
| Tracking ESG compliance and sustainability | Leveraging dashboards to track energy consumption, greenhouse gas emissions, and water usage to meet sustainability targets. Automated reporting tools ensure compliance and provide stakeholders with transparent ESG metrics. |
Building a successful custom dashboard requires careful planning, from its architecture to its rollout.
The development journey is a collaborative effort that typically follows a structured path to ensure the final product meets your precise business needs.
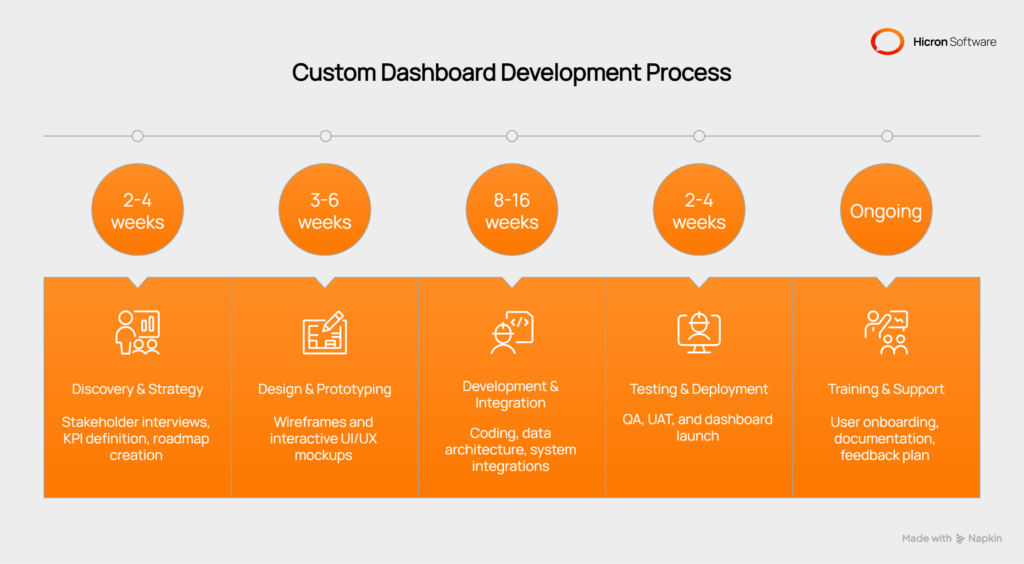
Stakeholder interviews, defining KPIs, auditing existing systems, and creating a project roadmap.
Creating wireframes and interactive mockups to define the user interface (UI) and user experience (UX).
Writing the code, building the data architecture, and integrating with third-party systems (BMS, ERP, etc.).
Rigorous quality assurance testing, user acceptance testing (UAT), and deploying the dashboard.
Onboarding users, providing documentation, and establishing an ongoing support and feedback plan.
Designing and implementing a custom dashboard for large-scale PropTech typically involves a combination of technologies across various layers of development.
| Category | Component | Technologies/Tools |
| Frontend | Frameworks/Libraries | React, Angular, Vue.js, D3.js, Chart.js, Highcharts, Plotly |
| Design Tools | Figma, Adobe XD, Sketch | |
| Backend | Languages | Python, Node.js, Java, .NET |
| Frameworks | Django, Express.js, Spring Boot, ASP.NET | |
| Databases | SQL (MySQL, PostgreSQL), NoSQL (MongoDB, Cassandra) | |
| Data management | ETL Tools | Talend, Apache Nifi, Informatica |
| Data Warehousing | Snowflake, Amazon Redshift, Google BigQuery | |
| APIs | RESTful, GraphQL | |
| Cloud and hosting | Cloud Platforms | AWS, Microsoft Azure, Google Cloud |
| Containerization | Docker, Kubernetes | |
| Security | Authentication | OAuth, OpenID Connect, SAML |
| Encryption | SSL/TLS | |
| DevOps and monitoring | CI/CD Tools | Jenkins, GitHub Actions, GitLab CI |
| Monitoring Tools | Grafana, Prometheus, New Relic | |
| AI and analytics | Machine Learning | TensorFlow, PyTorch, Scikit-learn |
| BI Tools | Tableau, Power BI, Looker |
These technologies work together to create a robust, scalable, and user-friendly custom dashboard tailored to the needs of large-scale property management businesses.
Costs are highly dependent on the project’s complexity. Key factors include the number of system integrations, the sophistication of the analytics, and the level of UI customization.
| Tier | Description | Estimated Cost Range |
| Basic | Connects to a few data sources with standard KPIs and reporting. | $50,000 – $100,000 |
| Advanced | Multiple integrations, role-based views, and some predictive analytics. | $100,000 – $300,000 |
| Enterprise | Fully bespoke solution with complex AI/ML models, deep integrations, and advanced security. | $300,000+ |
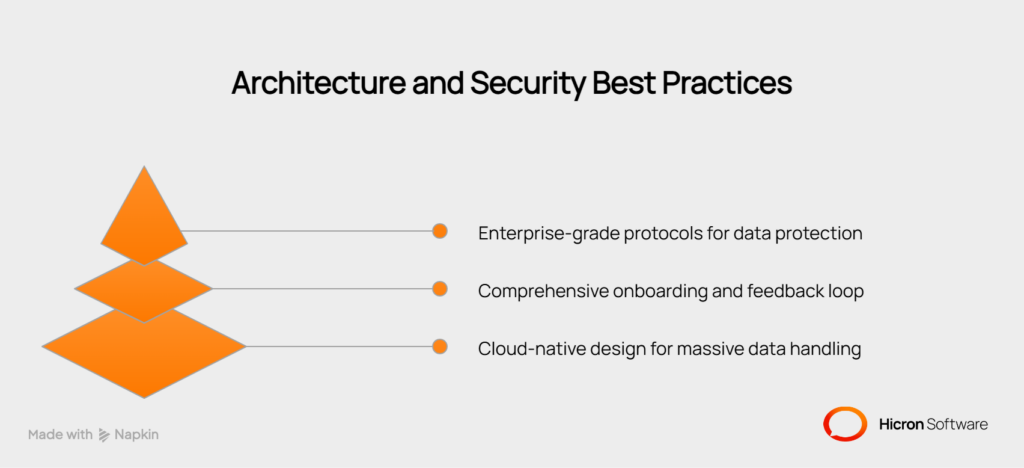
#1 Build a scalable architecture: Design a cloud-native foundation on a platform like AWS or Azure that can handle massive data volumes and user loads. Ensure the architecture is modular to allow for future expansion.
#2 Prioritize user training and adoption: A powerful tool is useless if no one knows how to use it. Develop a comprehensive onboarding program and establish a feedback loop to improve the dashboard continuously.
#3 Ensure security and compliance: Implement enterprise-grade security protocols to protect sensitive operational and financial data. Design the dashboard to support compliance with regulations like GDPR and meet ESG reporting standards.
Custom dashboards for large-scale PropTech are indispensable tools for managing the complexity of enterprise real estate portfolios. By centralizing data from systems such as BMS and IoT sensors, they eliminate silos and provide a unified view for strategic decision-making.
These dashboards go beyond basic reporting, leveraging predictive analytics and AI to uncover trends, optimize investments, and ensure long-term growth.
With scalable architecture and role-based customization, they adapt to evolving business needs while delivering actionable insights to stakeholders at every level. From streamlining ESG compliance to enhancing collaboration, custom dashboards empower enterprises to transition from reactive management to proactive, data-driven strategies.
Investing in a tailored dashboard solution is not just about managing data—it’s about gaining a competitive edge in the modern PropTech landscape. Reach us for more information about our services and how we can help you with your business.
Industries managing extensive physical assets, such as commercial real estate (CRE), logistics, large-scale residential housing, and public sector infrastructure (smart cities), see immense benefits.
They use a centralized data architecture, often cloud-based, to aggregate data from various properties and systems into a single source of truth, standardizing it for portfolio-wide analysis.
Yes, a key feature of custom dashboards is their ability to be built with custom APIs and connectors, allowing them to integrate with both modern and legacy enterprise software.
Common challenges include ensuring data quality from diverse sources, managing the change process across large teams, and defining clear, relevant KPIs for different user roles.
They provide executives with a high-level, real-time view of portfolio health, financial performance, and risk exposure, enabling them to identify strategic opportunities and make faster, more informed decisions.
Hicron’s contributions have been vital in making our product ready for commercialization. Their commitment to excellence, innovative solutions, and flexible approach were key factors in our successful collaboration.
I wholeheartedly recommend Hicron to any organization seeking a strategic long-term partnership, reliable and skilled partner for their technological needs.

After carefully evaluating suppliers, we decided to try a new approach and start working with a near-shore software house. Cooperation with Hicron Software House was something different, and it turned out to be a great success that brought added value to our company.
With HICRON’s creative ideas and fresh perspective, we reached a new level of our core platform and achieved our business goals.
Many thanks for what you did so far; we are looking forward to more in future!
Hicron is a partner who has provided excellent software development services. Their talented software engineers have a strong focus on collaboration and quality. They have helped us in achieving our goals across our cloud platforms at a good pace, without compromising on the quality of our services. Our partnership is professional and solution-focused!

The IT system supporting the work of retail outlets is the foundation of our business. The ability to optimize and adapt it to the needs of all entities in the PSA Group is of strategic importance and we consider it a step into the future. This project is a huge challenge: not only for us in terms of organization, but also for our partners – including Hicron – in terms of adapting the system to the needs and business models of PSA. Cooperation with Hicron consultants, taking into account their competences in the field of programming and processes specific to the automotive sector, gave us many reasons to be satisfied.
