May 14
18 min

Observability in DevOps goes far beyond simple monitoring—it’s about gaining deep insights into a system’s internal state by analyzing its external outputs. This capability lets teams diagnose complex issues in distributed systems without adding code or running additional tests. Unlike traditional monitoring with its focus on known failure patterns, observability shines when teams face unknown issues, providing the comprehensive visibility needed to solve novel problems.
In today’s complex landscape of cloud-native environments, microservices, containers, and serverless functions, observability isn’t just nice to have—it’s essential. Modern systems are simply too complex to troubleshoot through guesswork. Good observability practices allow DevOps teams to answer crucial questions about performance bottlenecks, user experience issues, and system health even when confronted with unfamiliar problems they’ve never seen before.
Effective observability stands on three foundational data types that work together to create a complete picture of what’s happening in your systems:
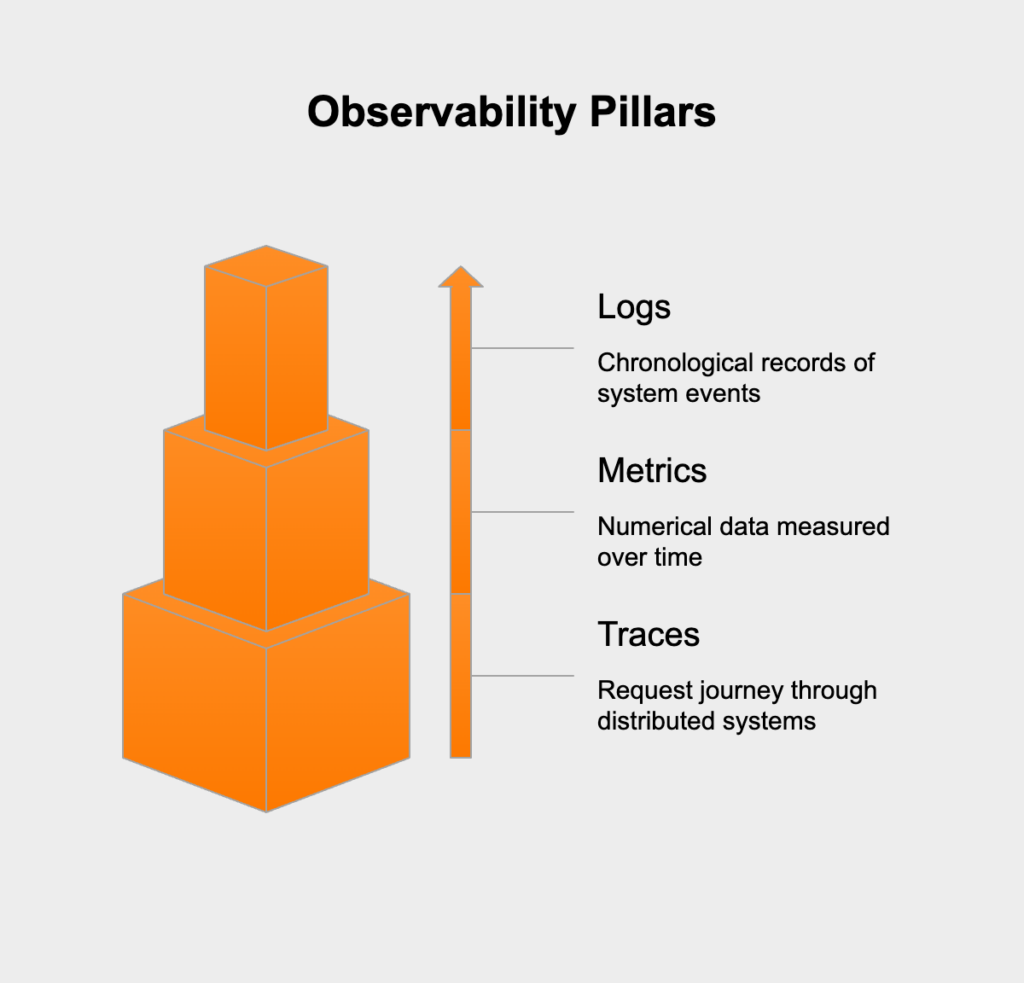
Logs serve as the detailed storytellers of your system—time-stamped records of discrete events happening within your applications and infrastructure. They provide rich contextual information about specific moments, capturing the details of errors, transactions, and system activities. What makes logs particularly valuable is their ability to show what happened and when with detailed context that other data types can’t match.
A typical application log might include error messages, user actions, or system events with critical details like timestamps, severity levels, and contextual information. For example:
2023-06-15T14:32:45.123Z ERROR [OrderService] Failed to process order #12345: Payment service unavailable
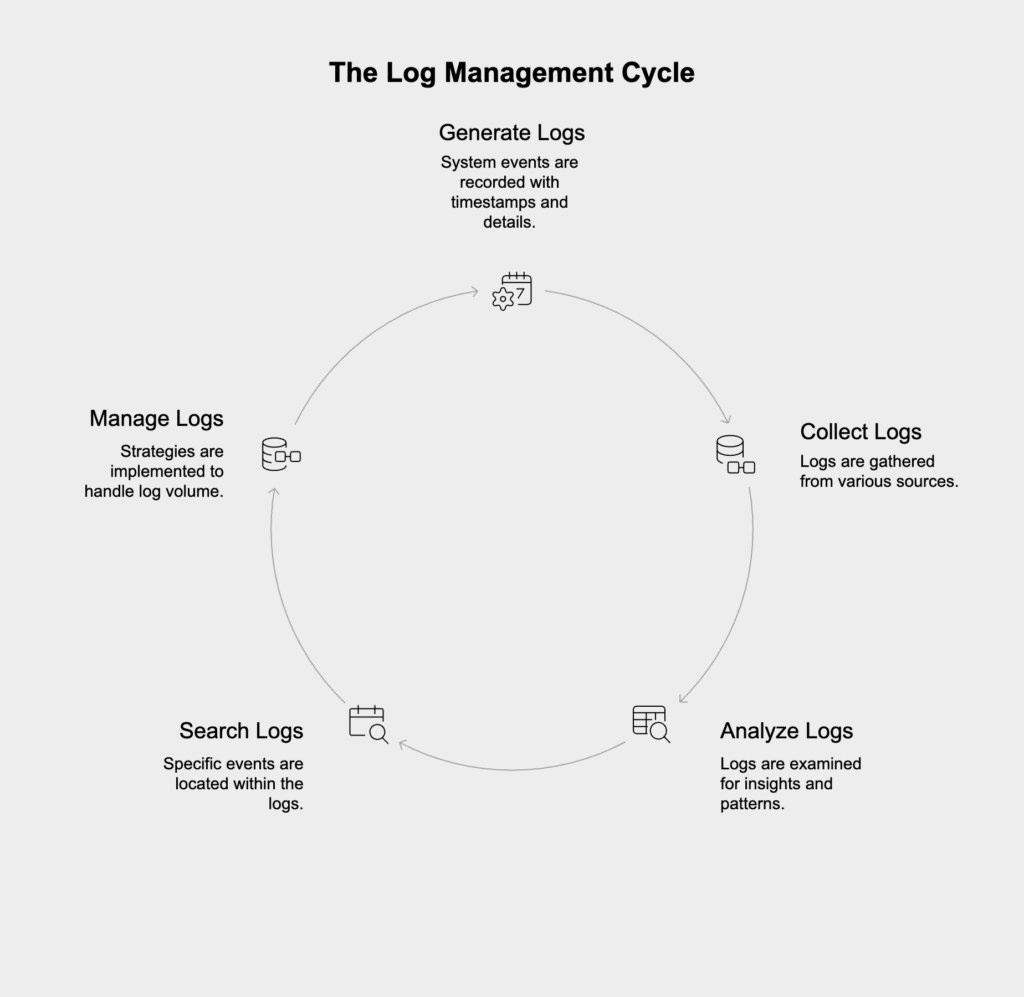
The challenge with logs comes in high-volume environments where they can quickly become overwhelming. That’s why targeted collection strategies and powerful search capabilities are essential for making logs truly useful rather than just another data haystack.
Metrics give you the numbers behind system behavior—numerical measurements collected at regular intervals that answer questions about how much and how often. Unlike the rich but unstructured nature of logs, metrics are lightweight, highly structured data points perfect for mathematical analysis, aggregation, and comparison.
Common metrics include:
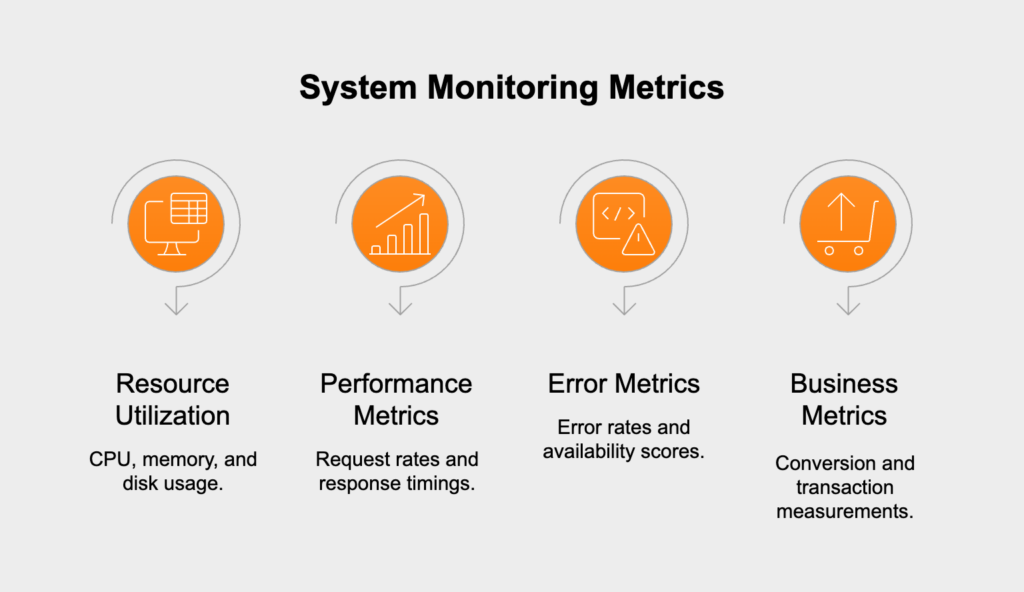
What makes metrics particularly valuable is their efficiency for alerting and visualization. They form the backbone of dashboards that give teams at-a-glance health information and serve as early warning systems when thresholds are breached or anomalies appear in normal patterns.
Traces track requests as they flow through distributed systems, revealing the relationships between services and pinpointing performance bottlenecks. Each trace represents a single transaction or request, capturing its complete journey with precise timing for each step along the way.
A trace consists of multiple spans, where each span represents work done by an individual service or component. Spans include:
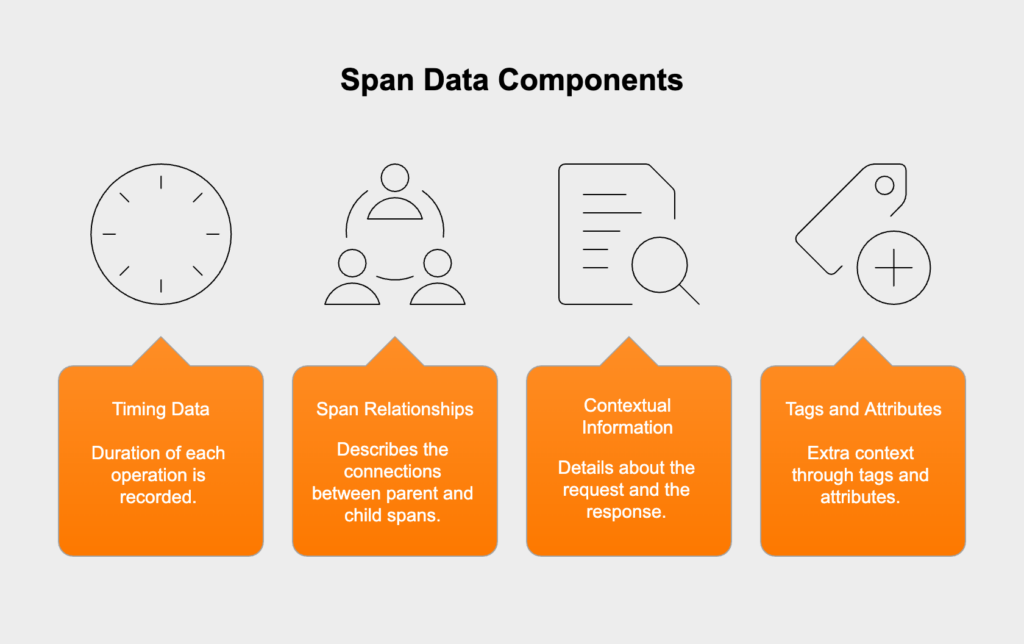
Traces become particularly valuable in microservices architectures where a single user action might trigger dozens of service interactions. When users complain about slowness, traces help answer the critical question: “Where exactly is the slowdown occurring?” This makes them indispensable for performance optimization in complex systems.
While observability and monitoring are related concepts that both contribute to system reliability, they differ in fundamental ways:
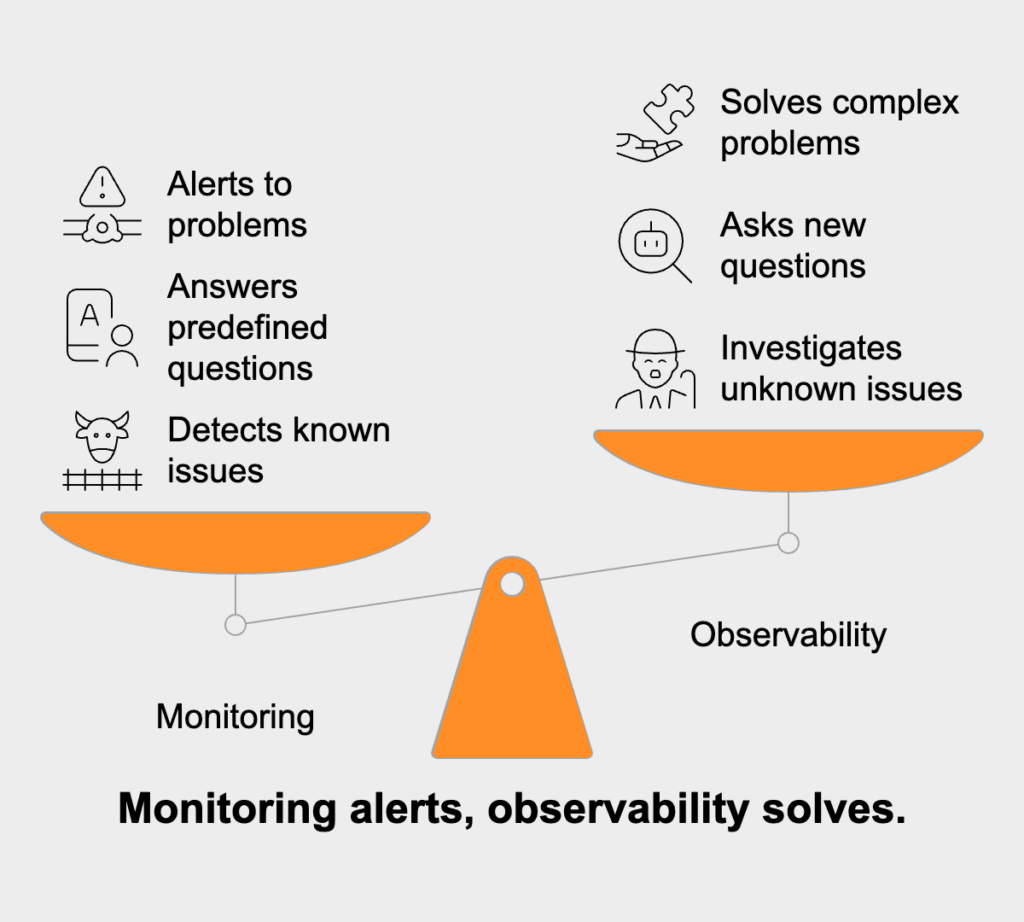
Monitoring acts like a watchdog, focusing on known metrics and logs against predefined thresholds. It answers straightforward questions like “Is the system down?” or “Has this metric crossed our danger threshold?” It relies heavily on dashboards with preset visualizations and alerts triggered by expected failure conditions.
Observability takes things much further by enabling teams to:
The key difference? Monitoring tells you when something’s wrong, while observability helps you figure out why it’s wrong and how to fix it—even for problems you’ve never encountered before. Good monitoring alerts you to problems; good observability helps you solve them.
Implementing observability in DevOps involves a continuous cycle of activities that help teams maintain system reliability:
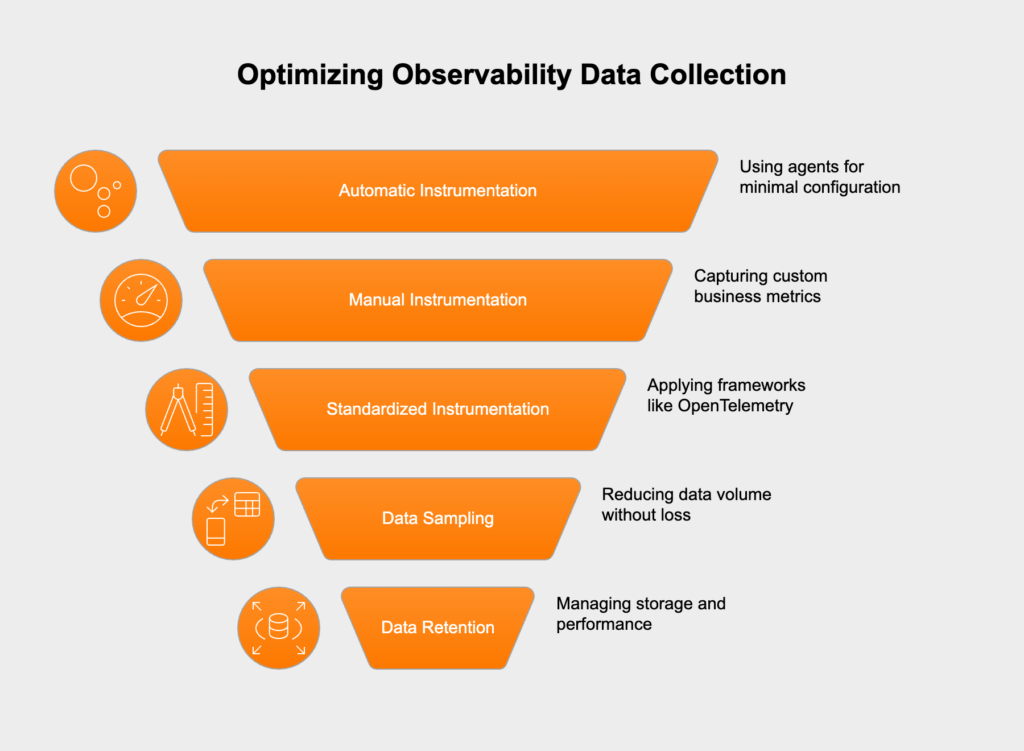
The foundation of observability is comprehensive data collection through instrumentation—the process of adding code to applications and infrastructure to generate telemetry data. Effective instrumentation strategies include:
The goal is to collect enough data to understand system behavior without overwhelming storage or creating performance overhead. This requires thoughtful decisions about sampling rates, data retention, and what specific events to capture.
Raw observability data is only valuable when teams can effectively visualize and explore it. This involves:
Effective visualization tools allow teams to pivot between different data types—starting with a metric anomaly, drilling down to related logs, and then examining traces to understand the full context of an issue.
Observability systems must alert teams to problems that require human intervention. This involves:
The goal is to notify the right people at the right time with enough information to begin resolving issues quickly, rather than overwhelming teams with alerts that don’t require immediate action.
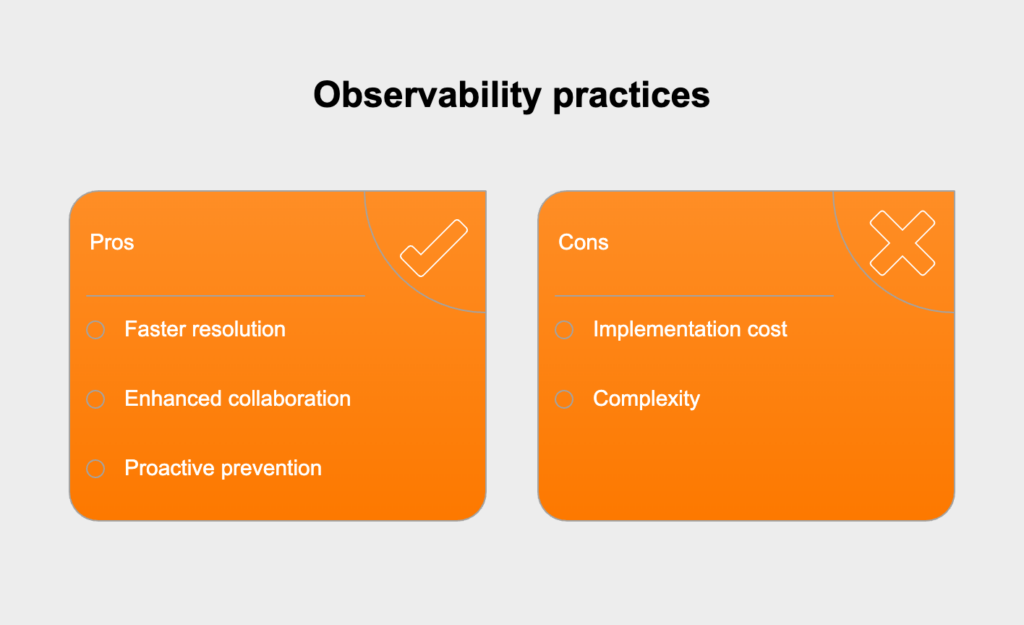
Implementing robust observability practices delivers several key benefits to DevOps teams:
Observability dramatically cuts the time needed to identify and resolve issues by providing immediate visibility into system behavior. When problems occur, teams can quickly:
This comprehensive visibility eliminates time-consuming guesswork and reduces mean time to resolution (MTTR) from hours to minutes for many incidents.
Observability creates a shared understanding of system behavior that bridges the gap between development and operations teams. When everyone has access to the same data and visualizations:
This shared context facilitates more effective incident response and promotes a culture of shared responsibility for system reliability.
Beyond reactive troubleshooting, observability enables teams to identify and address potential issues before they impact users. With comprehensive observability data, teams can:
This proactive approach shifts teams from firefighting to fire prevention, resulting in more stable systems and fewer incidents that affect users.
Successfully implementing observability requires a strategic approach that considers tools, practices, and organizational culture:
The observability tooling landscape includes a wide range of options, from open-source frameworks to comprehensive commercial platforms. When evaluating tools, consider:
Many organizations adopt a combination of specialized tools for different aspects of observability, while others prefer integrated platforms that provide a unified experience across all data types.
To ensure consistent, reproducible observability across environments, teams should define their observability configurations as code. This approach includes:
This practice ensures that observability evolves alongside the systems it monitors and prevents configuration drift between environments.
apiVersion: monitoring.coreos.com/v1
kind: PrometheusRule
metadata:
  name: api-service-alerts
spec:
  groups:
  - name: api.rules
rules:
- alert: HighErrorRate
  expr: sum(rate(http_requests_total{status=~"5.."}[5m])) / sum(rate(http_requests_total[5m])) > 0.05
  for: 2m
  labels:
    severity: critical
  annotations:
    summary: "High error rate detected"
description: "Error rate is above 5% for more than 2 minutes."Technical implementation alone isn’t enough—successful observability requires organizational adoption and cultural change:
The most successful organizations make observability a shared responsibility across all roles, not just a specialized function for operations or SRE teams.
Organizations implementing observability often face several common challenges:
Comprehensive observability generates enormous volumes of data, which can lead to significant storage costs and performance challenges. To address this, teams can:
The goal is to maintain sufficient data for effective troubleshooting without unnecessary cost or complexity.
As systems become more observable, teams risk creating too many alerts, leading to alert fatigue and ignored notifications. To combat this:
Effective alert strategies ensure that notifications represent actionable information requiring human intervention, not just interesting data points.
In distributed systems, maintaining context across service boundaries is essential for effective observability. Solutions include:
These practices ensure that teams can follow requests across service boundaries and correlate events from different system components.
The field of observability continues to evolve rapidly, with several emerging trends shaping its future:
AI and ML are transforming observability by automating pattern recognition and anomaly detection. These technologies enable:
As these technologies mature, they promise to reduce the cognitive load on engineers and enable more proactive system management.
Observability is increasingly shifting left in the software development lifecycle, influencing how applications are designed and built from the beginning:
This approach recognizes that effective observability isn’t something added after the fact but designed into systems from their inception.
The fragmentation of observability tools is giving way to more unified approaches:
These unified approaches reduce the cognitive overhead of switching between tools and provide more comprehensive visibility into complex systems.
DevOps Services you might explore:

Hicron’s contributions have been vital in making our product ready for commercialization. Their commitment to excellence, innovative solutions, and flexible approach were key factors in our successful collaboration.
I wholeheartedly recommend Hicron to any organization seeking a strategic long-term partnership, reliable and skilled partner for their technological needs.

After carefully evaluating suppliers, we decided to try a new approach and start working with a near-shore software house. Cooperation with Hicron Software House was something different, and it turned out to be a great success that brought added value to our company.
With HICRON’s creative ideas and fresh perspective, we reached a new level of our core platform and achieved our business goals.
Many thanks for what you did so far; we are looking forward to more in future!
Hicron is a partner who has provided excellent software development services. Their talented software engineers have a strong focus on collaboration and quality. They have helped us in achieving our goals across our cloud platforms at a good pace, without compromising on the quality of our services. Our partnership is professional and solution-focused!

The IT system supporting the work of retail outlets is the foundation of our business. The ability to optimize and adapt it to the needs of all entities in the PSA Group is of strategic importance and we consider it a step into the future. This project is a huge challenge: not only for us in terms of organization, but also for our partners – including Hicron – in terms of adapting the system to the needs and business models of PSA. Cooperation with Hicron consultants, taking into account their competences in the field of programming and processes specific to the automotive sector, gave us many reasons to be satisfied.
