September 11
19 min


Definition: Interactive dashboards for retail PropTech are centralized digital tools that transform complex operational, sales, and customer data into clear, visual, and actionable insights for retailers. These platforms serve as a command center, pulling information from various sources to provide managers with a comprehensive view of their business performance.
By making data easy to understand, these dashboards empower retailers to make more informed decisions that enhance the operation of their stores and the shopping experience for customers.
This article explains how interactive dashboards in retail PropTech turn data into insights. How they help analyze customer behavior, manage inventory, and boost sales. It covers features like real-time visualization, customizable widgets, and POS integration. You’ll also learn dashboard design tips and strategies for implementation.
Interactive dashboards for retail PropTech work by integrating information from multiple business systems into a single central location. They pull data from point-of-sale (POS) systems, customer relationship management (CRM) software, and even Internet of Things (IoT) devices, such as in-store sensors.
The main purpose of these retail PropTech solutions is to provide real-time retail dashboards that turn raw data into easy-to-understand visuals. This allows managers and teams to make better decisions quickly. The key technologies behind them include APIs for connecting different software, visualization platforms like Power BI or Tableau, and cloud infrastructure that supports data storage and processing.
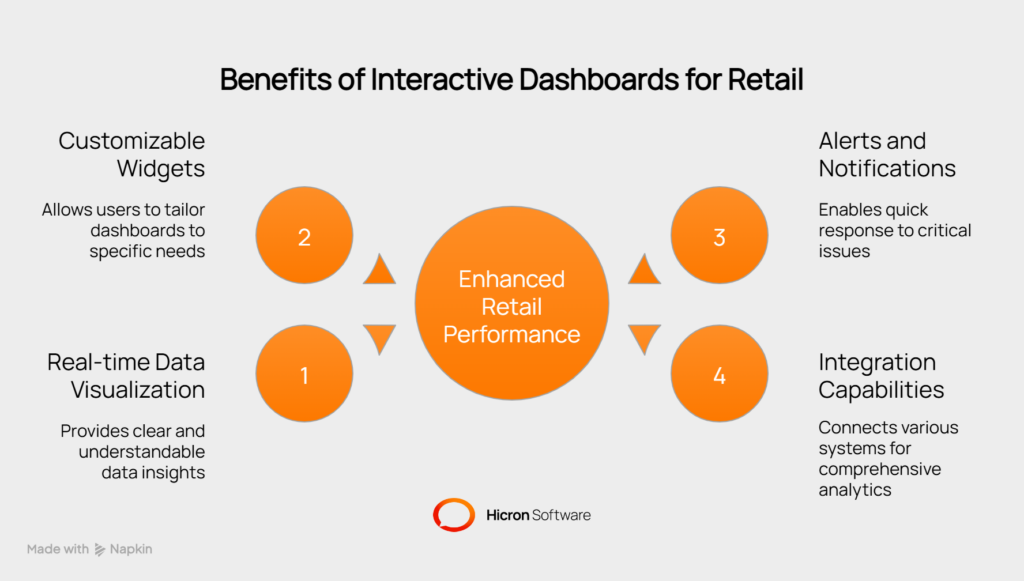
Retail PropTech solutions offer a range of benefits that help businesses stay competitive. They provide tools for detailed store performance tracking and better decision-making.
Effective retail data visualization makes complex information easy to understand. Interactive maps can show foot traffic analysis, helping to optimize store layouts. Dynamic charts and graphs present sales and inventory data clearly, while heatmaps can reveal the most popular areas within a physical store.
One of the main advantages is the ability to customize. Many platforms offer a drag-and-drop interface, allowing users to build their own dashboard views. They can add widgets for specific KPIs, such as sales per square foot or customer loyalty metrics. This allows for the creation of role-specific dashboards for store managers, marketing teams, and executives.
Real-time alerts help managers respond to issues quickly. Automated notifications can be set for low inventory levels or unusual dips in sales. Alerts can also be configured for spikes in foot traffic, negative customer feedback, or geofencing triggers for deliveries and staff arrivals.
Dashboards are most powerful when connected to other systems. This includes a direct connection with point of sale (POS) integration to track transactions as they happen. Integration with CRM tools provides deeper customer behavior insights, while APIs allow connections to e-commerce platforms, ERPs, and IoT sensors for true omnichannel retail analytics.
Interactive dashboards offer long-term strategic value that can reshape a retail business. They foster a culture of data-driven collaboration, provide clarity to leadership, and uncover sustainable cost-saving opportunities.
For example, the marketing team can see the direct impact of a digital campaign on in-store foot traffic, as reported by the dashboard. Simultaneously, the operations team can correlate this traffic with inventory levels, ensuring that promotional items remain in stock. This shared visibility allows for agile, coordinated strategies where marketing, sales, and supply chain teams work together toward common goals instead of in isolation.
For instance, a quarterly performance review can feature a dashboard view that visualizes sales growth, regional performance, and progress on KPIs. This level of transparent reporting builds trust and gives leadership the confidence to make strategic, data-backed investment decisions.
Likewise, predictive analytics can forecast staffing needs with greater accuracy, reducing overstaffing during slow periods and preventing understaffing during peak hours, optimizing labor costs over time.
Effective dashboards share a few core features that make them powerful tools for any enterprise.
To provide more specific context, here are some of the most critical KPIs for retail dashboards.
Table 1: Key Performance Indicators (KPIs) for Retail Dashboards
| KPI Category | Metric | Description | Data Source |
| Sales performance | Sales Per Square Foot | Measures store efficiency and revenue generation relative to its size. | POS System, Floor Plan Data |
| Average Transaction Value (ATV) | Tracks the average amount spent by a customer in a single transaction. | POS System | |
| Conversion Rate | Percentage of visitors who make a purchase. | Foot Traffic Sensors, POS System | |
| Customer behavior | Dwell Time | Average time a customer spends in the store or a specific department. | Wi-Fi Analytics, Video Sensors |
| Foot Traffic Patterns | Tracks customer movement to identify hot zones and dead areas. | Heatmap Technology, IoT Sensors | |
| Inventory management | Stock Turn Rate | How many times inventory is sold and replaced over a period? | Inventory Management Software |
| Sell-Through Rate | The percentage of units sold versus the amount of inventory received. | POS System, Inventory Logs |
When designing a dashboard for retail space use, prioritize a scalable and secure foundation. A cloud-native infrastructure is often the best choice, as it can handle massive data volumes from thousands of assets.
This approach provides the elasticity needed to grow with the business. At the same time, robust security protocols are essential to protect sensitive portfolio and financial data. It is also important to ensure compliance with data privacy laws, such as GDPR and CCPA.
Dashboards should provide different access levels to protect sensitive data. At the same time, allowing users to personalize their metrics and layout encourages them to use the tool regularly.
Large datasets can be overwhelming. The goal of an interactive dashboard design for retail operations is to make this data understandable and actionable.
Use advanced visualization tools, such as geospatial mapping, to show portfolio-wide metrics or complex charting to illustrate performance trends over time. The key is to present information in a way that is intuitive and leads to quick insights.
The design should prioritize clarity and simplicity. A logical information hierarchy ensures that the most important data is presented first, with options to explore details as needed.
Store managers and regional directors are often on the go. Dashboards must be fully functional on tablets and smartphones, with a touch-friendly design that makes accessing data easy from anywhere.
Table 2: Feature Prioritization for Retail Dashboard MVP
| Feature | Priority | Core Functionality | Justification |
| Real-time sales tracker | High | Live view of sales, transactions, and revenue. | Enables immediate decision-making and performance monitoring. |
| Inventory levels view | High | At-a-glance view of stock levels by SKU and location. | Critical for preventing stockouts and overstock situations. |
| Customer foot traffic | Medium | Visualization of store traffic by hour, day, and week. | Helps optimize staffing schedules and marketing efforts. |
| POS integration | Medium | Data sync from all Point of Sale terminals. | Ensures data accuracy and provides a single source of truth. |
| Predictive analytics | Low | AI-driven forecasts for sales and inventory needs. | Advanced feature; can be added post-launch to enhance strategy. |
When implementing interactive dashboards for retail PropTech, consider the following:

This table outlines the six key stages involved in implementing interactive dashboards for retail PropTech, along with their respective timelines and objectives. Each stage is designed to ensure a smooth transition from planning to deployment, helping businesses establish data-driven decision-making.
| Stage | Duration | Description | Example |
| Stage 1: Analysis | 1–2 weeks | Deep dive into processes, data architecture, and business needs. Includes workflow mapping, stakeholder interviews, and data source evaluation. | Discovering sales and inventory data are in separate systems, flagging integration as a priority. |
| Stage 2: Assessment | 1–2 weeks | Evaluate technical feasibility and resource requirements. Identify roadblocks (e.g., outdated hardware) and develop risk mitigation plans. | IT team highlights software limitations and outlines integration strategies. |
| Stage 3: Roadmap Planning | 2–3 weeks | Create a project timeline, set objectives, and assign roles. Define milestones, deadlines, and success metrics. | Schedule inventory and POS integration for month one, followed by user training. |
| Stage 4: Development and Integration | 6–12 weeks | Build and customize the dashboard. Establish data connections with tools like CRM and inventory software. Collaborate with vendors for tailored features. | Multi-location chains may require up to three months due to complex integrations. |
| Stage 5: Testing and Training | 2–3 weeks | Test the dashboard for accuracy, speed, and security. Simulate real-world scenarios to identify bugs. Train end users (e.g., store managers, marketers) to ensure adoption. | Conduct hands-on training for store managers to boost confidence in using the dashboard. |
| Stage 6: Go-Live and Rollout | 1–2 weeks | Deploy the dashboard in a live environment. Provide vendor support, monitor user feedback, and ensure system stability during the transition. | Vendors offer a help desk for queries and quick fixes for technical issues. |
Stage 1: Analysis (1–2 weeks)
The process begins with a deep dive into existing processes, data architecture, and business needs. This stage might include workflow mapping, stakeholder interviews, and evaluation of available data sources. For example, a retailer might discover that sales and inventory data are tracked in separate systems, flagging integration as a priority.
Stage 2: Assessment (1–2 weeks)
In this phase, technical feasibility and resource requirements are measured. The IT team may assess current infrastructure, highlight potential roadblocks (such as outdated hardware or software limitations), and outline preliminary integration strategies. Risk factors are identified, and mitigation plans are developed.
Stage 3: Roadmap planning (2–3 weeks)
Next, the leadership team creates a detailed project timeline, sets clear objectives, and assigns roles. Milestones, deadlines, and success metrics are established, such as aiming to launch the dashboard in eight weeks or ensuring at least 90% adoption among store managers. Example: A retailer may schedule inventory and POS integration for month one, with user training to follow.
Stage 4: Development and Integration (6–12 weeks)
This is where technical teams build and customize the dashboard. Data connections are established with existing tools such as customer relationship management (CRM) and inventory management software. During this stage, retailers often work closely with vendors to tailor features like custom reporting or real-time alerts. For a multi-location chain, this period can stretch to three months due to complex integration needs.
Stage 5: Testing and training (2–3 weeks)
Before full rollout, the dashboard undergoes thorough testing for accuracy, speed, and security. Simulated data entries and real-store scenarios help identify bugs and ensure reliable performance. Simultaneously, end users—store managers, marketers, and executives—receive hands-on training to boost confidence and encourage adoption.
Stage 6: Go-live and rollout (1–2 weeks)
The dashboard is deployed in a live environment. In the early days, vendors may provide close support, a dedicated help desk for queries, and prompt fixes for any unforeseen technical issues. Teams monitor user feedback and system stability to ensure a smooth transition from old workflows to the new data-driven approach.
Before adopting new retail analytics tools, businesses often face several hurdles. Understanding these challenges can help create a smoother transition.
Most modern implementations rely on cloud-based infrastructure for scalability and remote accessibility. Integration with IoT sensors (such as those tracking foot traffic or environmental conditions) enables real-time insights. AI and machine learning modules support predictive analytics and automation, while advanced visualization tools transform raw data into intuitive, easy-to-read dashboards.
| Feature | Description | Example |
| Cloud-based infrastructure | Enables scalable storage and real-time access to data from anywhere. | Managers can review sales performance or inventory levels from any device, bypassing store servers. |
| Internet of Things (IoT) sensors | Capture real-time data within retail locations, such as foot traffic, environmental conditions, or product movement. This data feeds directly into dashboards for instant insights. | Foot traffic counters at entrances or RFID trackers monitoring product movement. |
| AI and machine learning (AI/ML) modules | Analyze retail data to forecast demand, predict customer behavior, and automate alerts. | AI identifies sales trends or sends alerts for low stock SKUs. |
| Advanced data visualization tools | Transform raw data into interactive charts, heatmaps, and customizable reports. | Dashboards showing conversion rates by region or sales spikes by hour. |
| API integrations | Allow connection with POS, ERP, and CRM systems to aggregate all relevant information in one place. | |
| Mobile optimization | Supports access to analytics and alerts on smartphones and tablets, essential for multi-location or on-the-go teams. | Retail managers can respond to alerts while on the move. |
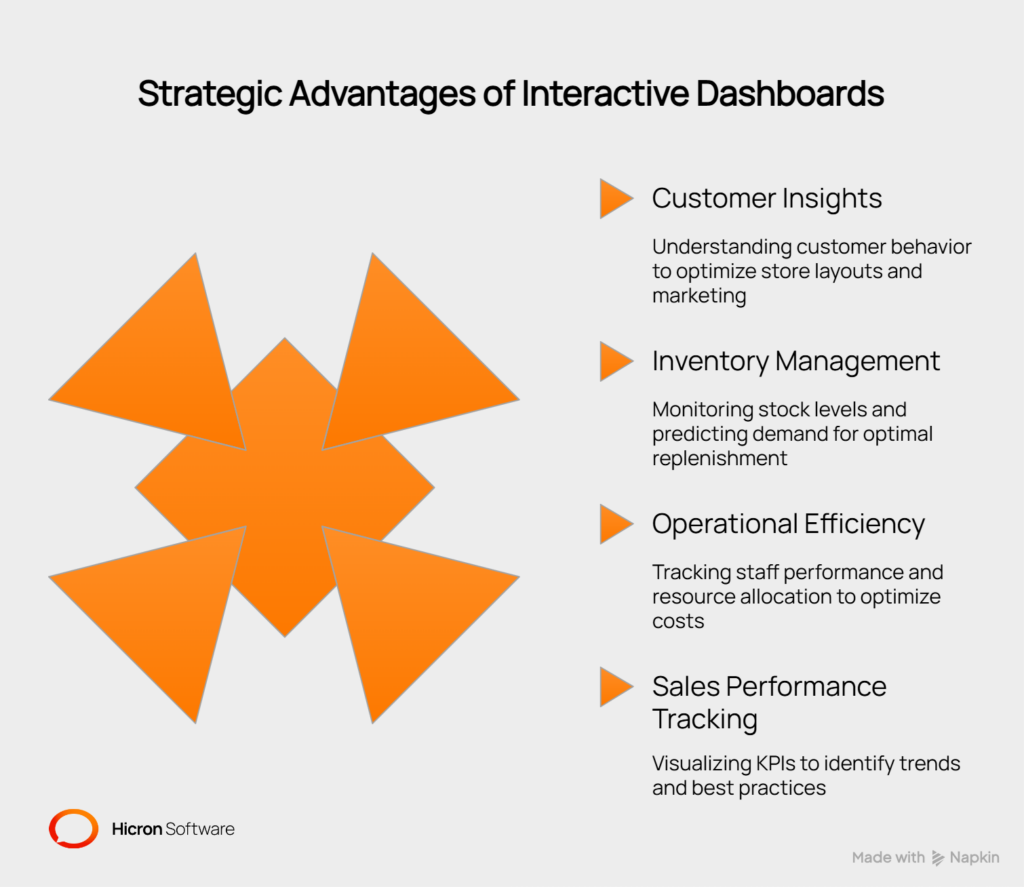
Beyond the core features, these dashboards provide deeper strategic advantages that can transform retail operations.
Retailers can track in-store foot traffic patterns and customer flow with IoT sensors. Analyzing dwell times in certain zones helps optimize store layouts by identifying peak shopping areas. By connecting purchasing data to customer behavior, retailers can create targeted marketing campaigns and personalize offers in real time. For example, a global apparel brand can use dashboard analytics to measure ‘customer dwell time’ and adjust merchandising to improve engagement.
With inventory management software features, retailers can monitor stock levels in real time to prevent stockouts or overstocking. AI-powered predictive analytics can forecast demand for specific products, ensuring optimal replenishment. This also streamlines supply chain visibility from the warehouse to the shelf, allowing for the tracking of metrics like ‘stock turnover rate.’
Dashboards help track staff performance and allocate resources based on hourly sales and foot traffic. They can also monitor energy consumption and facility maintenance needs, helping to optimize costs. Reporting for sales, compliance, and daily operations can be automated, allowing managers to spot and address issues promptly.
These tools allow for the visualization of key performance indicators (KPIs) like conversion rates, average transaction value, and customer retention. It becomes easy to compare sales performance across different stores or regions to identify outliers and best practices. Retailers can also identify top-performing products and sales trends instantly, supporting dynamic pricing and promotional strategies.
Interactive retail dashboards are tools that unify data, improve decision-making, and enhance both customer experience and operational performance. They allow retailers to see their business with a new level of clarity and respond to changes with speed and precision.
By investing in tailored, data-driven dashboards, retailers can transition from reactive management to proactive strategies, unlocking new opportunities for growth, efficiency, and a sustainable competitive advantage.
Do you need a customized dashboard solution for your company? Get in touch with us to discuss how we can help you implement interactive retail dashboards tailored to your needs.
A retail PropTech dashboard is a digital tool that collects and displays data on foot traffic, sales, and inventory in a clear visual format.
They provide real-time visibility into stock levels, help forecast demand, and send automated alerts for low stock situations, which helps prevent stockouts and reduce carrying costs.
Yes, modern dashboards are designed to connect with common retail systems like Point of Sale (POS), Customer Relationship Management (CRM), and Enterprise Resource Planning (ERP) through APIs.
Yes, many solutions are scalable. This allows small retailers to start with essential features and expand the dashboard’s capabilities as their business grows.
By analyzing foot traffic and dwell times, retailers can optimize store layouts, adjust staffing levels during peak hours, and ensure popular products are well-placed and stocked to better serve customers.
Hicron’s contributions have been vital in making our product ready for commercialization. Their commitment to excellence, innovative solutions, and flexible approach were key factors in our successful collaboration.
I wholeheartedly recommend Hicron to any organization seeking a strategic long-term partnership, reliable and skilled partner for their technological needs.

After carefully evaluating suppliers, we decided to try a new approach and start working with a near-shore software house. Cooperation with Hicron Software House was something different, and it turned out to be a great success that brought added value to our company.
With HICRON’s creative ideas and fresh perspective, we reached a new level of our core platform and achieved our business goals.
Many thanks for what you did so far; we are looking forward to more in future!
Hicron is a partner who has provided excellent software development services. Their talented software engineers have a strong focus on collaboration and quality. They have helped us in achieving our goals across our cloud platforms at a good pace, without compromising on the quality of our services. Our partnership is professional and solution-focused!

The IT system supporting the work of retail outlets is the foundation of our business. The ability to optimize and adapt it to the needs of all entities in the PSA Group is of strategic importance and we consider it a step into the future. This project is a huge challenge: not only for us in terms of organization, but also for our partners – including Hicron – in terms of adapting the system to the needs and business models of PSA. Cooperation with Hicron consultants, taking into account their competences in the field of programming and processes specific to the automotive sector, gave us many reasons to be satisfied.
