11 DevOps Maturity Assessment Questions to Ask During the Audit
- April 02
- 6 min


Think of DevOps monitoring as the eyes and ears for the whole software development journey. Its main job is giving teams a continuous, real-time look at how applications, systems, and infrastructure are performing, their overall health, and their security status.
By keeping a close watch on important metrics and events—right from planning and coding through to deployment and daily operations—monitoring helps everyone understand how systems behave, spot when things aren’t working as expected, and catch potential problems early. This constant stream of feedback is vital for keeping things stable, ensuring quality, and making the fast, ongoing improvements that DevOps is all about.
Unlike older methods where monitoring was often just an operations task tacked on at the end, DevOps weaves monitoring into every single step of the SDLC. It starts right at the beginning, using performance data to help shape planning. It continues during coding and integration, keeping track of build success and code quality. Through testing, it confirms how the software holds up under stress.
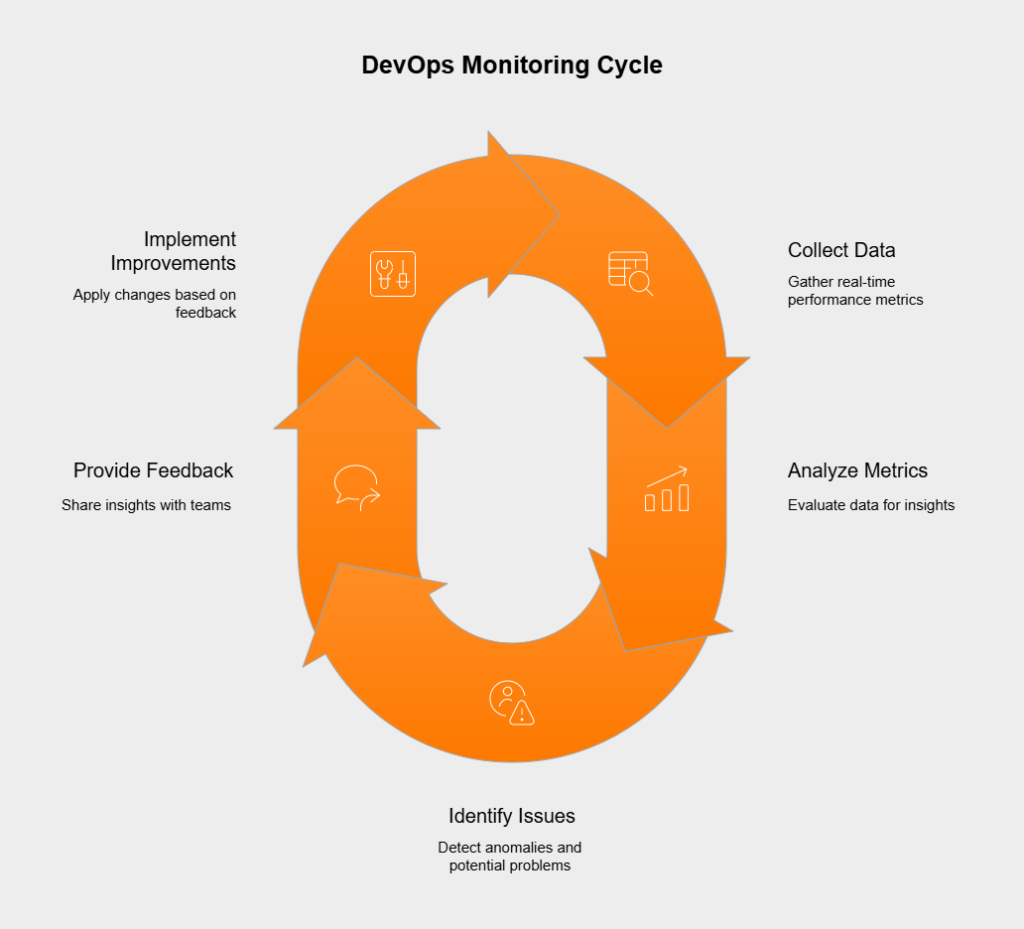
Once deployed, monitoring shifts focus to watch application health, infrastructure stability, and what users are actually experiencing in the live environment. This complete end-to-end integration means performance and stability are always top of mind, not an afterthought. It allows teams to find and fix issues much sooner, often well before they affect anyone using the software.
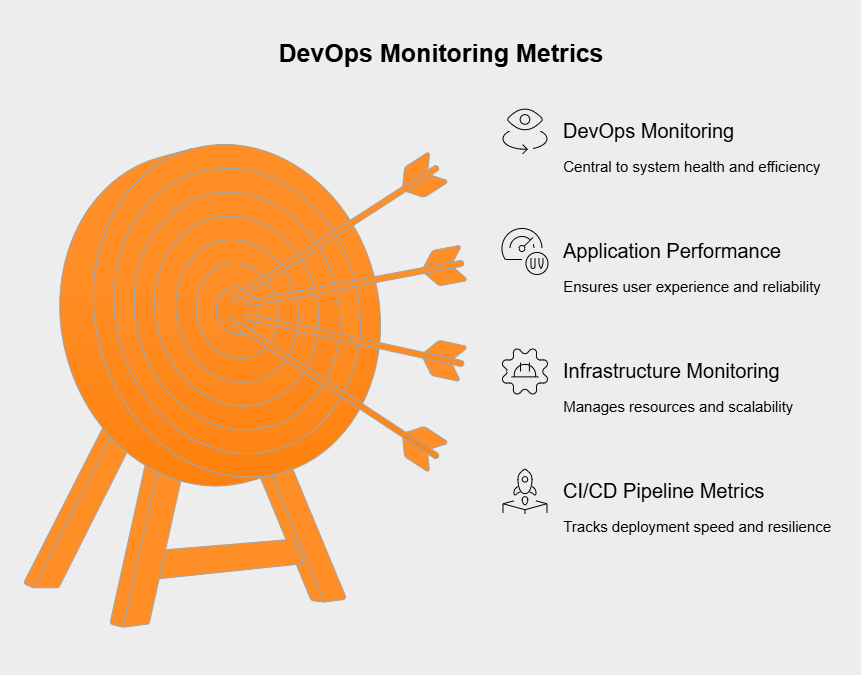
Effective DevOps monitoring zeroes in on specific, measurable key performance indicators (KPIs) to offer real insights into system health and how efficient the processes are. These metrics generally cover a few core areas. Teams need to watch aspects that directly affect the end-user, measuring things like application response times, how often errors pop up (like HTTP 5xx codes), application uptime, whether transactions are completing successfully, and user satisfaction levels when possible; this helps make sure the application feels quick, dependable, and provides a good experience.
It’s also crucial to monitor the underlying infrastructure supporting the applications, keeping an eye on vital signs like CPU utilization, memory consumption, disk activity (I/O rates and available space), and network performance including latency and bandwidth usage; watching these helps head off resource shortages, figure out when scaling is needed, and confirm the infrastructure can handle the application’s demands.
Tracking metrics related to the CI/CD pipeline itself is key for DevOps speed and reliability, including how often code gets deployed (deployment frequency), how often deployments fail, the time it takes for a code change to reach production (change lead time), and how quickly the team can recover after a failed deployment (Mean Time To Recover or MTTR); these numbers show how fast, dependable, and resilient the development and release processes really are.
DevOps monitoring isn’t just one thing; it covers several specialized areas to give a full picture across the tech stack and development process. APM, or Application Performance Monitoring, zooms in on how well software applications are performing and whether they’re available, specifically from the user’s point of view. It usually involves looking at transaction traces, performance right down to the code level, how the application depends on other services, error rates, and overall user experience data. APM tools are great for finding slowdowns hidden in the application code or in how it talks to other parts of the system.
This area focuses on checking the health and performance of the physical hardware and network gear underneath everything. It means tracking server stats (CPU, RAM, disk usage), how virtual machines are doing, container health (especially in systems like Kubernetes), database performance, and the status of network equipment like routers and switches, along with network lag and data loss. This ensures the foundation holding up the applications is solid and running smoothly.
Beyond just performance, DevOps monitoring also keeps an eye on security and whether processes are being followed correctly. This involves tracking security alerts, results from vulnerability scans, who accessed what (access logs), changes to configurations (to spot unexpected alterations), and whether everything meets required policies or standards. It also includes watching the CI/CD pipeline itself – tracking build successes and failures, code commits, pull requests, and test results to make sure the whole development workflow is running efficiently and securely.
DevOps monitoring really helps bring Development (Dev) and Operations (Ops) teams together, breaking down the old walls between them. By offering a shared, real-time view of how applications and systems are doing—using common dashboards and alert systems—it creates one reliable source of information for everyone. When something goes wrong, both Dev and Ops can look at the exact same data, making it much faster to figure out the problem and work together on a fix. This shared visibility helps each team understand the other’s challenges, promotes a sense of shared ownership for keeping applications healthy, and speeds up feedback, all of which strengthens the teamwork that’s essential for DevOps to work well.
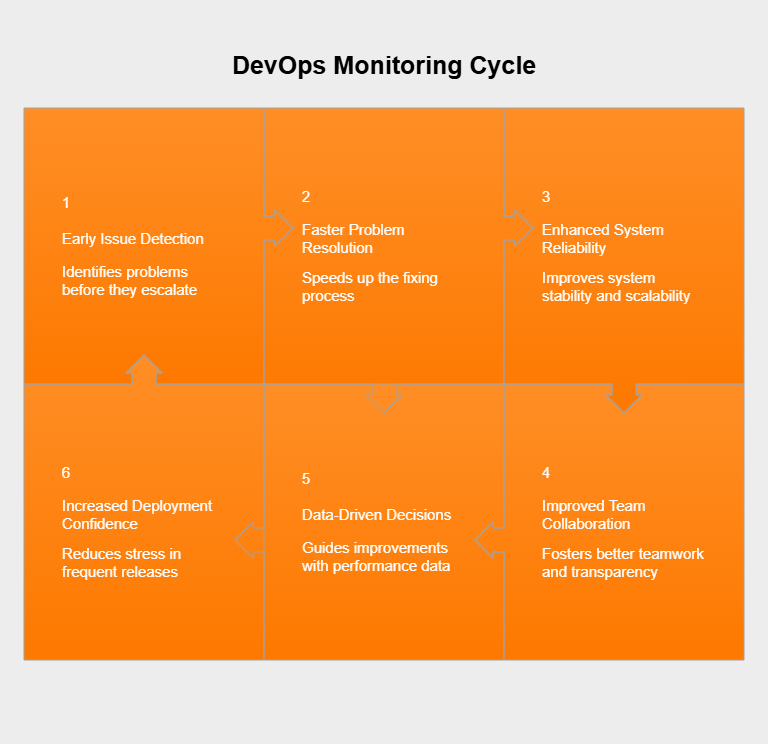
Putting good DevOps monitoring in place brings some major wins for the software development process and the business itself. Some key advantages include:
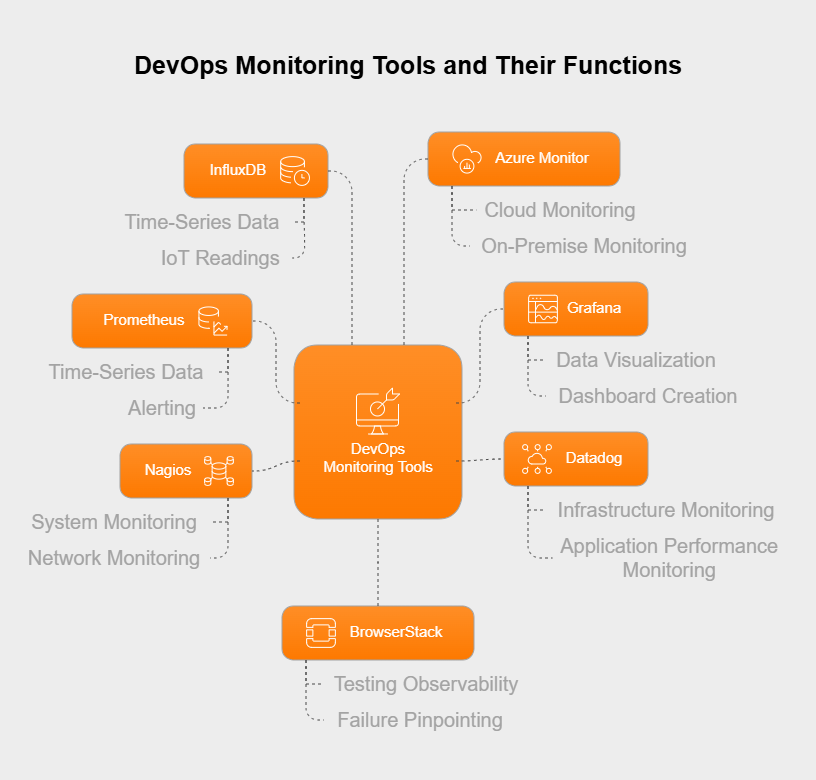
There’s a whole host of tools available to handle different parts of DevOps monitoring. The right tools depend on your specific tech stack and what you need to achieve, but here are some frequently used examples:
These tools generally provide ways to collect data, store it, visualize it, send alerts, and connect with other tools in the CI/CD pipeline.
Monitoring and observability are definitely related, but they aren’t quite the same thing. Monitoring usually involves collecting and analyzing specific metrics and logs based on what you already know about a system—essentially, tracking expected problems and performance indicators (“known unknowns”). It answers questions like, “Is the CPU running hot?” or “What’s the application error rate?”.
Observability, however, is about getting deeper insights into how a system is behaving, especially complex ones like microservices, by looking at signals like logs, metrics, and distributed traces together. Its goal is to let teams ask unexpected questions about the system’s state to figure out surprising issues (“unknown unknowns”).
So, while monitoring tells you *when* something predefined is wrong, observability helps you understand *why* it’s wrong by letting you explore the system’s internal state through the data it produces. A solid DevOps approach often uses monitoring for basic health checks and alerts, adding observability practices on top for more thorough troubleshooting and understanding.
Setting up a great DevOps monitoring strategy takes more than just installing some tools. Following best practices helps ensure your monitoring setup actually delivers real value. First off, before you even pick tools, be really clear about what you need to monitor and why. Connect your monitoring goals directly to specific business objectives, application Service Level Objectives (SLOs), and technical needs. Focus on metrics that give you useful information you can act on, rather than just collecting tons of data for the sake of it. This involves defining clear monitoring objectives aligned with your goals.
Automation is absolutely vital for dealing with today’s dynamic and large-scale environments. Automate the gathering of metrics, logs, and traces as much as you can. Set up automated analysis to spot unusual patterns and configure smart alerting systems that get the right information to the right teams quickly, without overwhelming them with noise. You might even consider automated fixes or self-healing actions for common, predictable problems.
Bring data from all your different monitoring tools and sources together into central dashboards. Use visualization tools to build a “single-pane-of-glass” view that’s customized for different people involved (like Dev, Ops, Security, or Business teams). This gives everyone a unified picture, makes it easier to see connections between different parts of the system, and helps speed up decision-making.
Go beyond traditional monitoring by adopting observability practices. Make sure your applications and systems are set up (instrumented) to produce detailed logs, metrics, and traces. Use tools and methods that let your teams freely explore this data. This allows for much deeper root-cause analysis and a clearer understanding of how complex systems work together, which is especially important in microservices or cloud-native setups.

Hicron Software proved to be a trusted partner with unmatched technical expertise, delivering a scalable and user-friendly web application that was pivotal to our successful U.S. market expansion.

Hicron’s contributions have been vital in making our product ready for commercialization. Their commitment to excellence, innovative solutions, and flexible approach were key factors in our successful collaboration.
I wholeheartedly recommend Hicron to any organization seeking a strategic long-term partnership, reliable and skilled partner for their technological needs.

After carefully evaluating suppliers, we decided to try a new approach and start working with a near-shore software house. Cooperation with Hicron Software House was something different, and it turned out to be a great success that brought added value to our company.
With HICRON’s creative ideas and fresh perspective, we reached a new level of our core platform and achieved our business goals.
Many thanks for what you did so far; we are looking forward to more in future!
Hicron is a partner who has provided excellent software development services. Their talented software engineers have a strong focus on collaboration and quality. They have helped us in achieving our goals across our cloud platforms at a good pace, without compromising on the quality of our services. Our partnership is professional and solution-focused!

The IT system supporting the work of retail outlets is the foundation of our business. The ability to optimize and adapt it to the needs of all entities in the PSA Group is of strategic importance and we consider it a step into the future. This project is a huge challenge: not only for us in terms of organization, but also for our partners – including Hicron – in terms of adapting the system to the needs and business models of PSA. Cooperation with Hicron consultants, taking into account their competences in the field of programming and processes specific to the automotive sector, gave us many reasons to be satisfied.
