11 DevOps Maturity Assessment Questions to Ask During the Audit
- April 02
- 6 min


DevOps metrics are like the vital signs for your software development and IT operations. They’re essentially quantifiable measurements that let you track how well things are running within a DevOps setup. These numbers give you real, objective insights into every stage of getting software out the door – from the moment code is committed right through to deployment and keeping things running smoothly in production.
Why bother? Because these metrics help teams spot bottlenecks, see the actual impact of the changes they make, figure out if workflows are effective, and make sure everything aligns with what the business needs. Keeping an eye on these indicators gives everyone a clearer picture of the delivery pipeline’s health, infrastructure stability, and overall operational muscle.
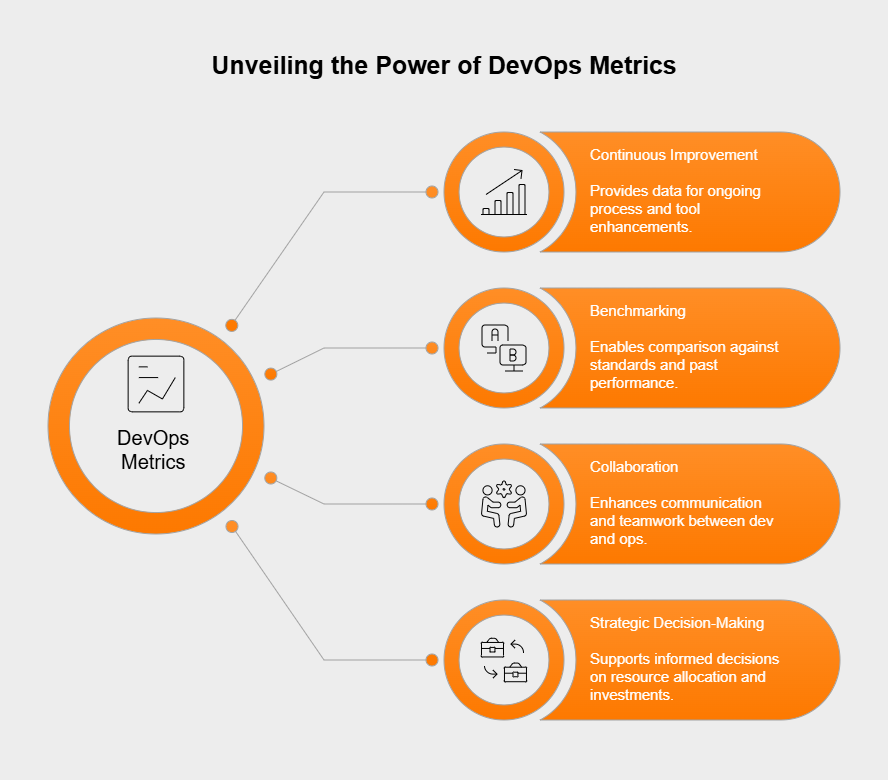
Keeping track of DevOps performance with specific metrics isn’t just busywork; it’s essential for a few key reasons. First off, it fuels continuous improvement. You get hard data showing what’s working and what’s not across processes, tools, and how teams work together, letting you make smart tweaks where needed.
Second, metrics allow for meaningful benchmarking. You can see how you stack up against industry standards (like the DORA metrics) or your own past performance, helping set achievable goals for getting better.
Third, having objective numbers gets everyone on the same page; it boosts communication and collaboration between dev and ops teams because they share a common understanding of performance and targets.
Finally, this performance data backs up strategic decision-making – it helps leaders justify spending on new tools or training, put resources where they’ll do the most good, and clearly show how DevOps is adding value through speed, stability, and efficiency.
The “big four” DORA metrics, coming straight from Google’s DevOps Research and Assessment (DORA) team, are widely seen as the gold standard for measuring software delivery and operational chops. They strike a smart balance, looking at both speed (throughput) and reliability (stability). These crucial metrics are Deployment Frequency, Lead Time for Changes, Change Failure Rate (CFR), and Mean Time to Recovery (MTTR). Teams that score well across these four tend to be high-performing DevOps units, which strongly links to overall business success.
Deployment Frequency simply counts how often your team successfully pushes code updates to production. It’s a direct measure of your team’s capacity to deliver value quickly and reliably. A higher number here usually points to a slicker, more automated delivery pipeline. Top-tier teams often deploy multiple times a day or whenever needed, showing off a mature CI/CD process and impressive agility and responsiveness to business demands.
Lead Time for Changes tracks the clock from the moment code is committed until it’s successfully running in production. This metric tells you a lot about the overall efficiency of your entire development and deployment workflow. Shorter lead times mean things are running smoothly, automation is effective, and feedback loops are tight. Elite teams often get this down to less than an hour, demonstrating remarkable process efficiency and the ability to pivot fast when the market shifts or fixes are needed.
Change Failure Rate (CFR) looks at the percentage of deployments going to production that end up causing problems needing a fix (like a rollback or an urgent patch). It’s a core indicator of your deployment quality and overall system stability. A low CFR suggests you’ve got solid testing, dependable infrastructure, and good change management habits. High-performing teams usually aim for a CFR between 0% and 15%, proving that moving fast doesn’t have to break things or sacrifice production reliability.
Mean Time to Recovery (MTTR) measures, on average, how long it takes to get service back online after something goes wrong in production. This metric highlights how well your organization can spot, figure out, and fix issues – essentially, its operational resilience. A lower MTTR points to effective monitoring, smart alerting, quick incident response, and possibly a well-thought-out system design. Elite teams frequently achieve an MTTR under an hour, which minimizes disruption for users and ensures high system availability through speedy incident recovery speed.
While the DORA metrics are foundational, plenty of other valuable DevOps metrics offer deeper dives into specific parts of the software lifecycle and operational health. Think of these as supplemental indicators that help round out the performance picture, covering areas like how value flows, system wellness, development speed, and code quality. Tracking these alongside DORA allows for more fine-grained analysis and helps pinpoint specific areas for improvement across the whole value stream.
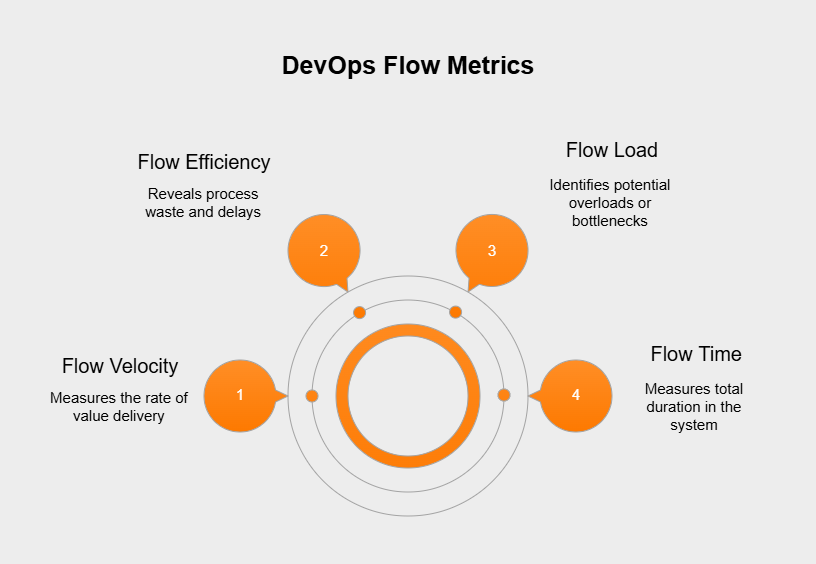
Flow Metrics keep tabs on how work items (like features, bug fixes, or other changes) move through your system, from the initial idea all the way to delivery. Some key examples are:
These metrics help you visualize and streamline the entire delivery process to get the most value out efficiently.
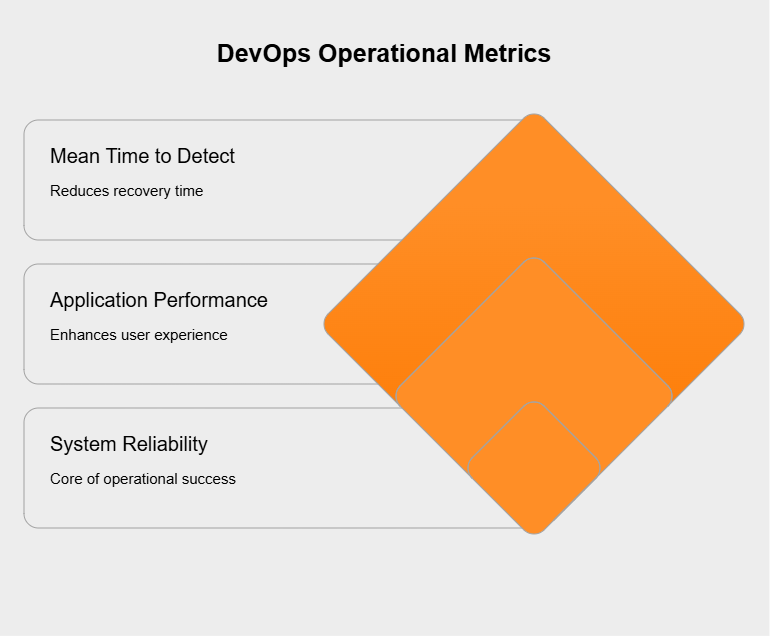
Operational metrics zero in on how well your systems are performing, staying reliable, and remaining available in the production environment. Important ones include:
Keeping an eye on these is crucial for meeting service level expectations and keeping end-users happy.
Development metrics offer clues about how efficient and effective your coding and building activities are. Consider these:
These help fine-tune the early stages of the software delivery cycle before deployment.
Quality metrics focus squarely on how reliable and solid the code being built and shipped actually is. Key metrics here are:
These metrics help make sure the software you deliver isn’t just fast, but also dependable and easy to maintain.
Getting real value from DevOps metrics means doing more than just collecting numbers; you need to weave them into your team’s culture and daily routines. Make the metrics visible, talk about them regularly, and use them to spark concrete improvements. It’s better to watch trends over time than obsess over single data points, and always try to understand the ‘why’ behind the numbers. Using metrics well means building a culture of openness, learning, and making decisions based on data to constantly get better at delivering value.
Benchmarking is super helpful because it gives your DevOps metrics context. It’s about comparing your team’s or organization’s numbers (like DORA scores) against industry norms, similar teams, or even just your own past performance. This comparison shines a light on where you’re strong and where you could improve, helps set realistic goals, and shows where you stand in terms of maturity and competitiveness. Benchmarking basically answers, “Are we doing well compared to others or how we used to do?” and helps steer efforts to get better.
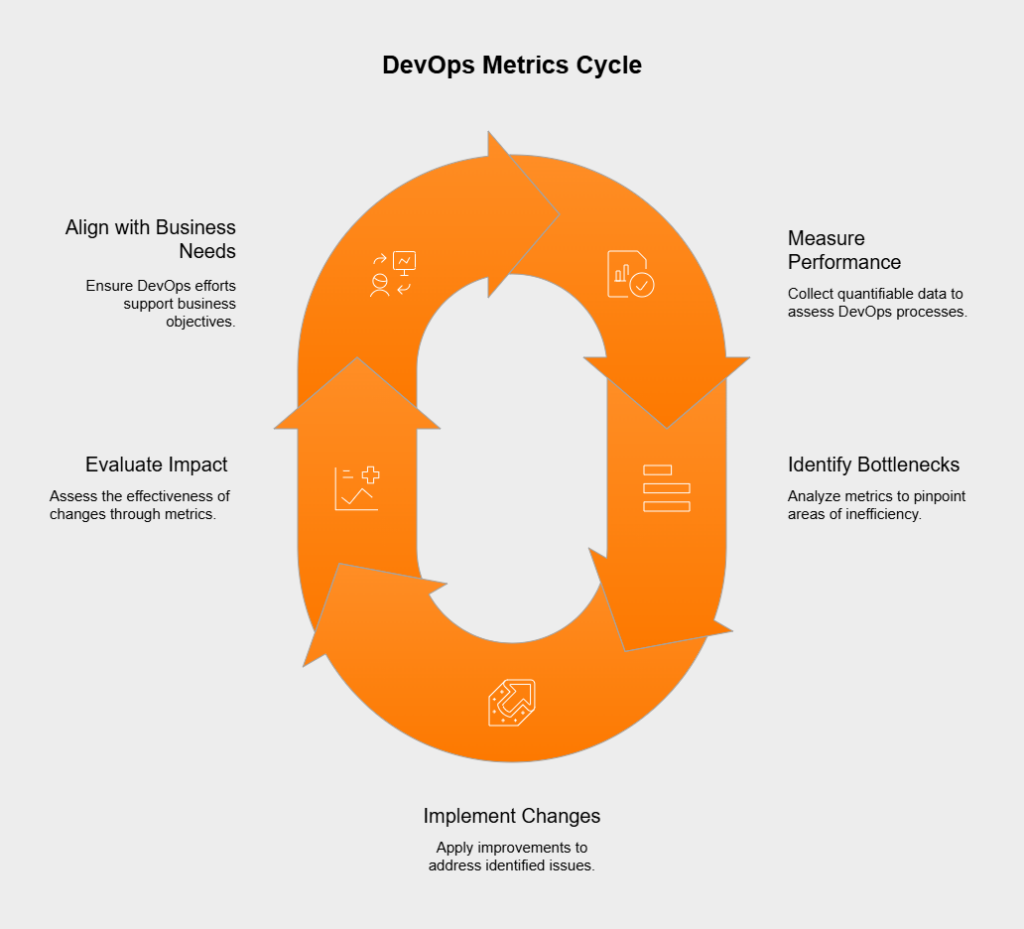
Continuous improvement and DevOps metrics go hand-in-hand. Metrics provide that crucial objective feedback loop needed to spot areas ripe for enhancement. By watching key indicators like Lead Time for Changes or Change Failure Rate, teams can zero in on bottlenecks or recurring problems. Looking at trends in these metrics lets teams try out potential solutions – maybe adopting a new tool, tweaking a process, or boosting automation – and then use the very same metrics to see if those changes actually worked. This ongoing cycle of measure, analyze, improve, and measure again is the heart of continuous improvement in DevOps.
Pushing your DevOps metric results higher usually involves a mix of strategies targeting people, processes, and technology. Some effective approaches include:
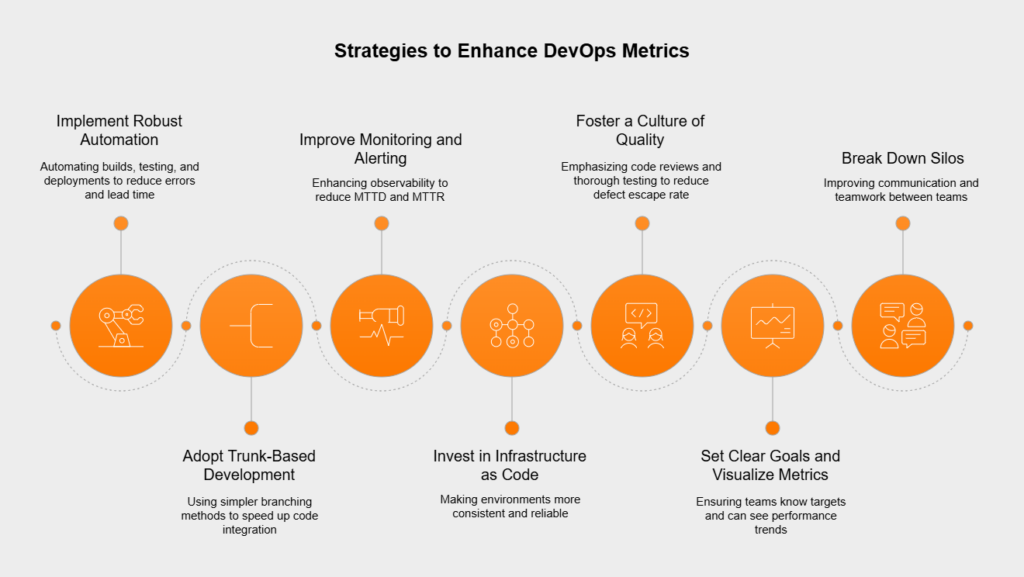
Applying these strategies thoughtfully helps teams boost their DORA scores and overall DevOps game. If you need support in measuring DevOps Metrics, get in touch!

Hicron Software proved to be a trusted partner with unmatched technical expertise, delivering a scalable and user-friendly web application that was pivotal to our successful U.S. market expansion.

Hicron’s contributions have been vital in making our product ready for commercialization. Their commitment to excellence, innovative solutions, and flexible approach were key factors in our successful collaboration.
I wholeheartedly recommend Hicron to any organization seeking a strategic long-term partnership, reliable and skilled partner for their technological needs.

After carefully evaluating suppliers, we decided to try a new approach and start working with a near-shore software house. Cooperation with Hicron Software House was something different, and it turned out to be a great success that brought added value to our company.
With HICRON’s creative ideas and fresh perspective, we reached a new level of our core platform and achieved our business goals.
Many thanks for what you did so far; we are looking forward to more in future!
Hicron is a partner who has provided excellent software development services. Their talented software engineers have a strong focus on collaboration and quality. They have helped us in achieving our goals across our cloud platforms at a good pace, without compromising on the quality of our services. Our partnership is professional and solution-focused!

The IT system supporting the work of retail outlets is the foundation of our business. The ability to optimize and adapt it to the needs of all entities in the PSA Group is of strategic importance and we consider it a step into the future. This project is a huge challenge: not only for us in terms of organization, but also for our partners – including Hicron – in terms of adapting the system to the needs and business models of PSA. Cooperation with Hicron consultants, taking into account their competences in the field of programming and processes specific to the automotive sector, gave us many reasons to be satisfied.
